

2. Hummingbird

This guide explains how to use Hummingbird’s performance and optimization features to speed up your site while preserving resources.
Hummingbird requires PHP 7.4 or greater. See WPMU DEV Minimum Requirements for details.
Once Hummingbird is installed and activated, refer to this guide for assistance configuring and managing Hummingbird. The index on the left provides quick access to guidance on specific features.
If you haven’t installed Hummingbird yet, then you should visit the Hummingbird page where you can explore the plugin’s many features, and where WPMU DEV members can install Hummingbird Pro directly to any connected site.
Note that if you have multiple WordPress performance plugins activated, they may conflict with each other and lead to unpredictable behavior or even break your site. The following list of plugins may cause issues with Hummingbird:
- Autoptimize
- W3 Total Cache
- LiteSpeed Cache
- WP Performance Score Booster
- WP Fastest Cache
- Speed Booster Pack PageSpeed & Performance Optimization
- WP-Optimize
- WP Performance
- Swift Performance Lite
- WP Super Cache
- WP Rocket
- WP Speed of Light
- Jetpack Boost
- 10Web Booster
- SiteGround Optimizer
- Super Page Cache
We recommend only using one performance plugin at a time for the best results.
Upon activation or when certain features are configured, this plugin may add cookies to the user’s browser, store personal information in your database, or integrate with 3rd-party applications. You may need to disclose this information to your site visitors. For details, see Our Plugins in our privacy policy documentation.
Every WPMU DEV hosted site comes fully loaded with Pro versions of the following plugins automatically installed for you: Smush, Hummingbird, Defender, SmartCrawl, and Forminator. Not hosting with us yet? Check out our Hosting page to see if we might be a good fit for your projects.
We’ve put together some awesome tutorials on optimizing content & pages created with some of the most popular page builders out there. If you’re using any of the ones listed below, we highly recommend checking out the associated posts to help you get the most out of Hummingbird.
Optimize Elementor Using Smush and Hummingbird
Optimize Elementor for Core Web Vitals Using R.O.S.E.
Optimize WPBakery Sites
Optimizing WPBakery’s Impreza Theme
Optimize Divi with Hummingbird and Smush
Optimizing Astra with Hummingbird and Smush
How to Speed Up Slider Revolution in WordPress
Speed Up and Optimize Avada Using Smush and Hummingbird
2.1 Quick Setup Wizard
Copy chapter anchor to clipboardThe Quick Setup Wizard will give you an opportunity to run a Performance Test right away before configuring anything in the plugin.
The wizard appears the first time the plugin is activated, or if you use the Reset option in the plugin Settings.
If you do not wish to run an initial test, you can exit the wizard by clicking the Skip for now link or the X icon in the top-right corner. That will close the wizard and take you to the Hummingbird Dashboard.
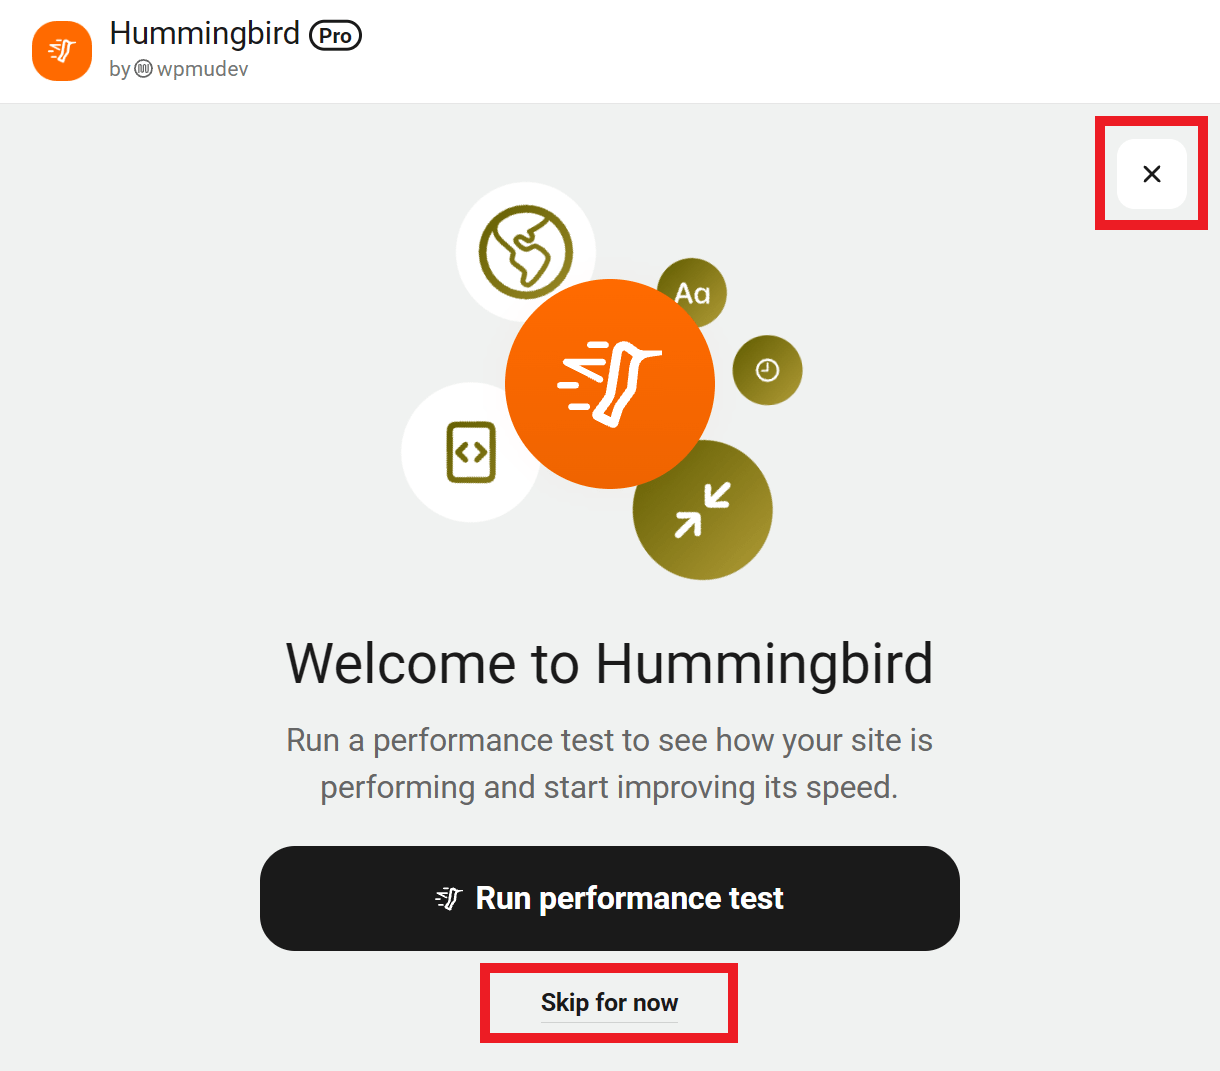
Clicking the Run performance test button will start your initial test, which usually takes less than a minute. You’ll see the test progress displayed as it runs.
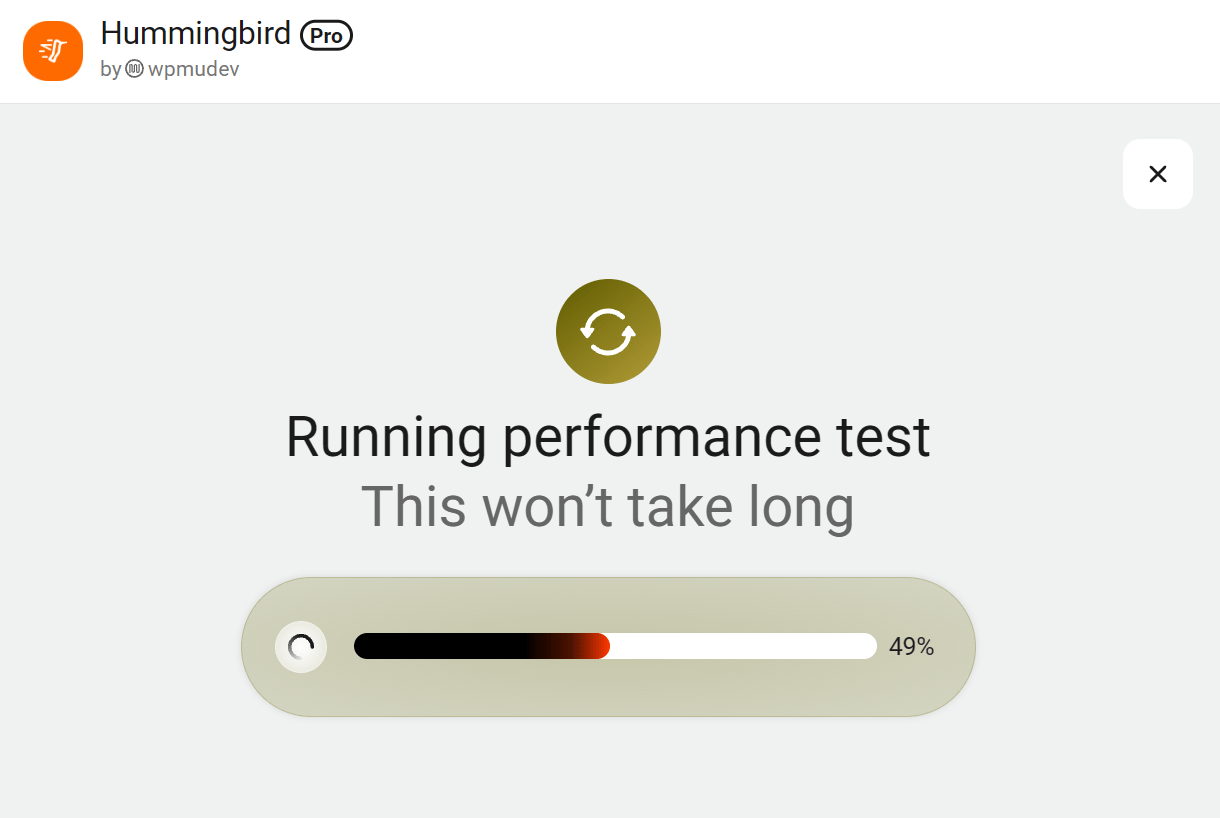
Once the test completes, you’ll be automatically redirected to the Dashboard where you can view the test results.
2.2 Dashboard
Copy chapter anchor to clipboardThe Dashboard provides an overview of your site’s performance status and quick access to key actions and features.
2.2.1 Header Bar
Link to chapter 2The header bar is displayed across all screens in Hummingbird and provides quick access to key tools and resources. Click WPMU DEV to navigate to The Hub, your central dashboard for managing all your WPMU DEV-connected sites.

Enable Safe Mode to test any optimization settings you apply in Hummingbird without affecting your website visitors’ experience.

Quickly access WPMU DEV support and this usage guide by clicking the corresponding icons.

The cloud icon indicates the status of the auto-save feature, which briefly changes to a spinner while changes are being saved.

If you are working offline, this icon’s color will change to red and a banner will appear at the top of the screen to remind you that changes will auto-save once you’re back online.

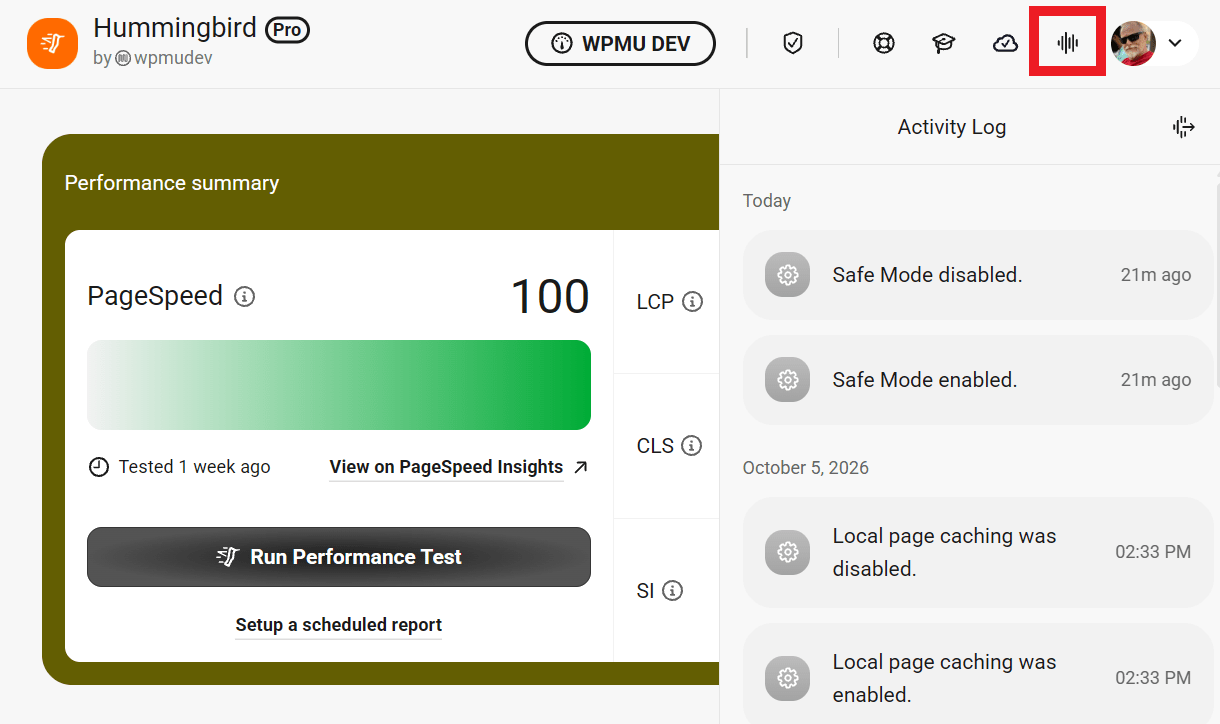
You can also open the Activity Log sidebar, which displays a timestamped record of all actions performed in Hummingbird. The icon appears in green when there is new activity, and turns grey once you have viewed all activity.
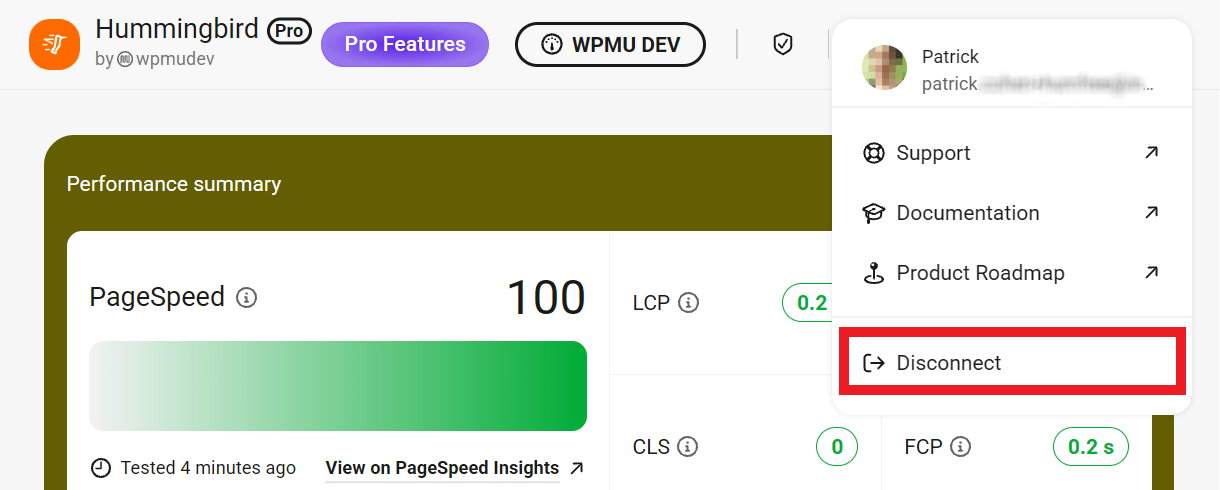
Click your profile image to access a menu with links to Support, Documentation, and the Product Roadmap.
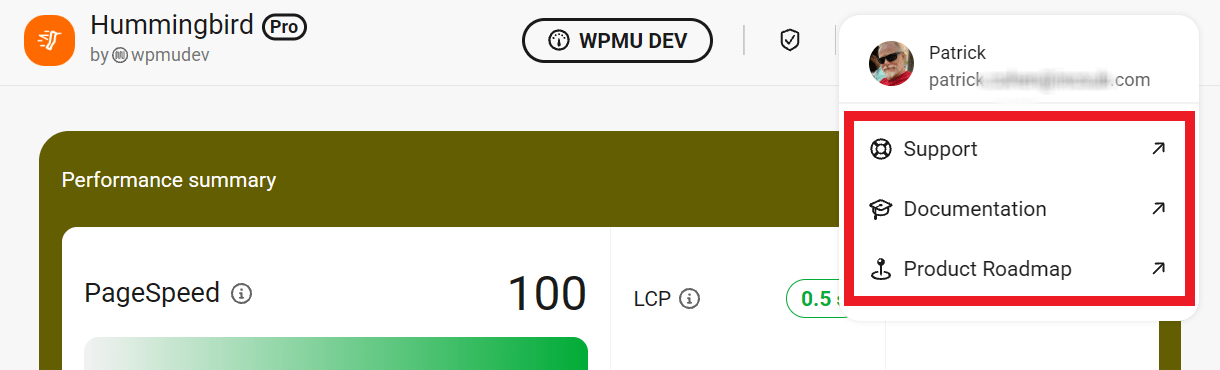
If your site is connected to a free WPMU DEV account, an additional Disconnect option appears in the menu, allowing you to disconnect your site from the account.
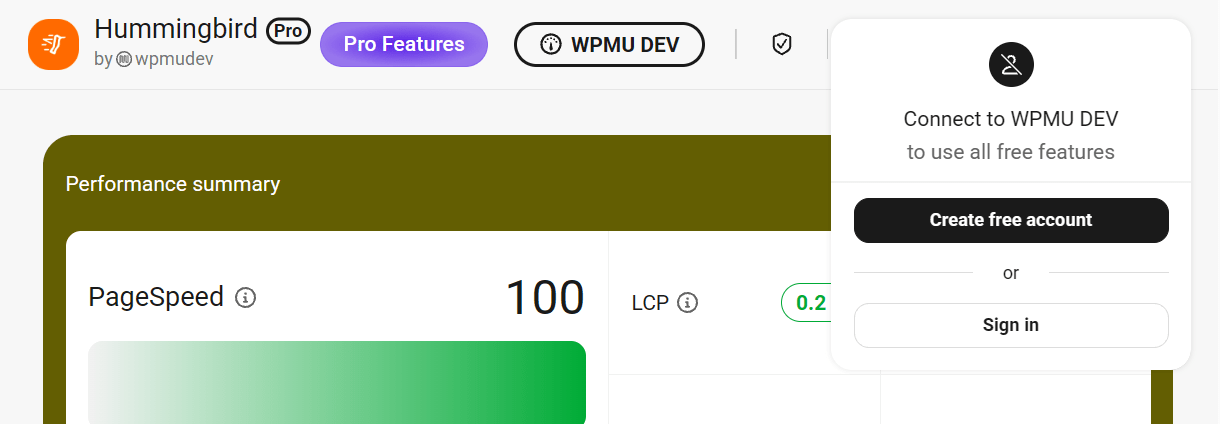
If your site is not yet connected to a WPMU DEV account, a crossed-out profile icon appears in its place. Clicking it prompts you to connect by either creating a free account or signing into an existing one.
2.2.2 Performance Summary Panel
Link to chapter 2The Performance Summary panel allows you to run performance tests and view the results right in the Dashboard.
Performance Test
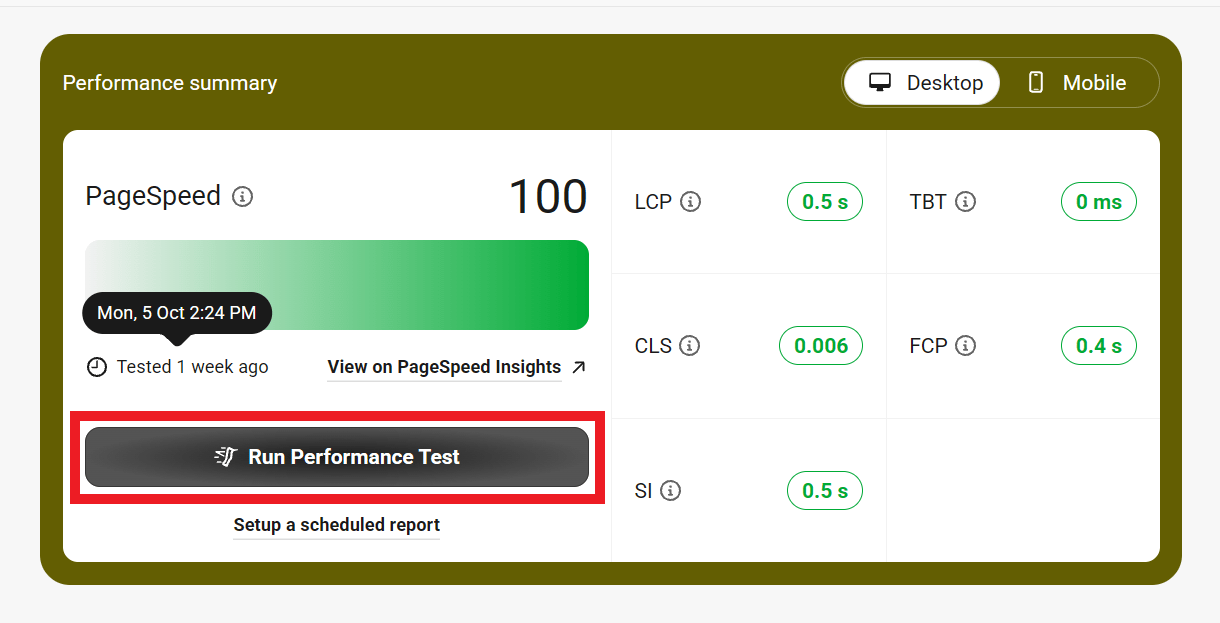
You can trigger an immediate test of your site’s performance at any time by clicking the Run Performance Test button. The date and time of the last scan is displayed directly above the button for reference.
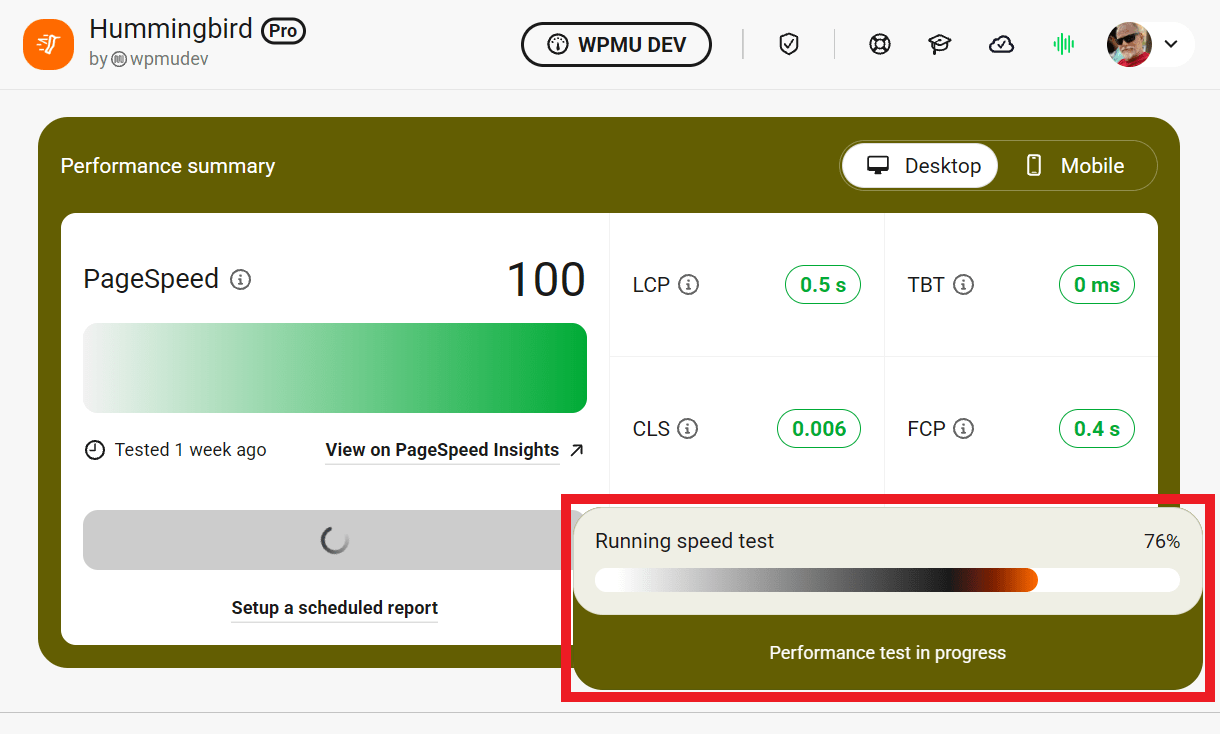
While the test is running, a progress bar appears in the bottom-right corner of the screen showing the current test status.
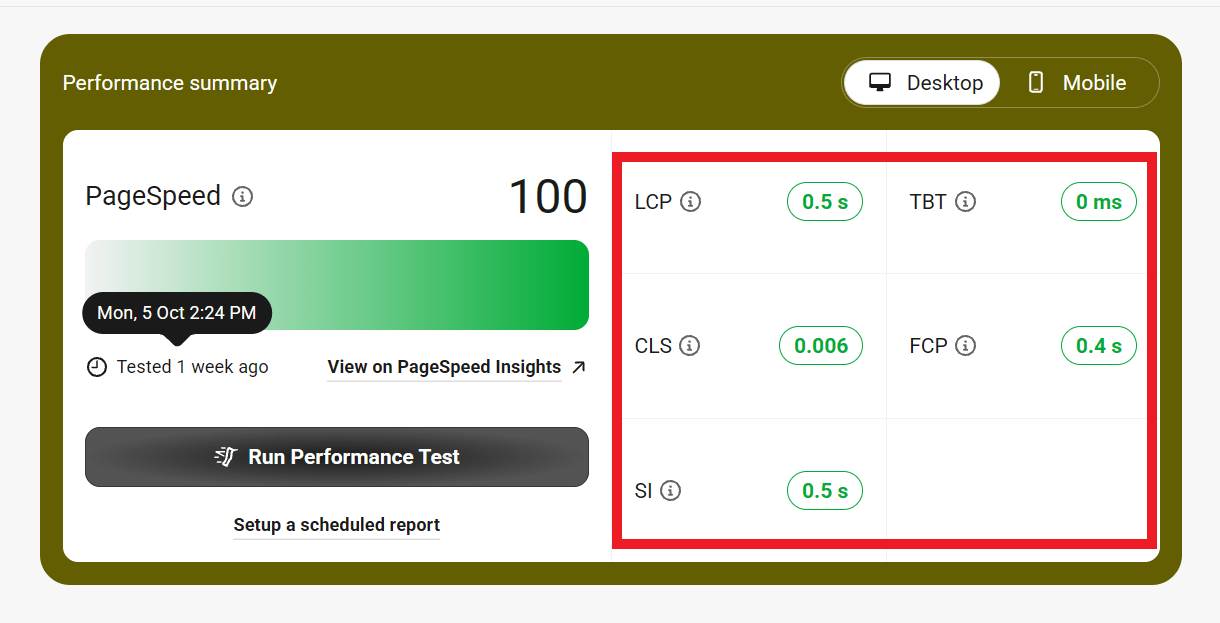
Once the test has completed, a summary of your current performance will appear with a breakdown of the key metrics used to determine your overall score. See Score Metrics below for more information.
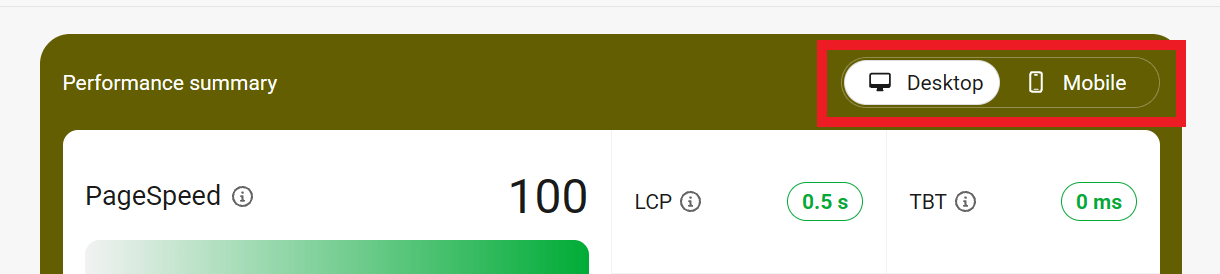
Click the Desktop/Mobile toggle at the top-right to switch between Desktop and Mobile reports.
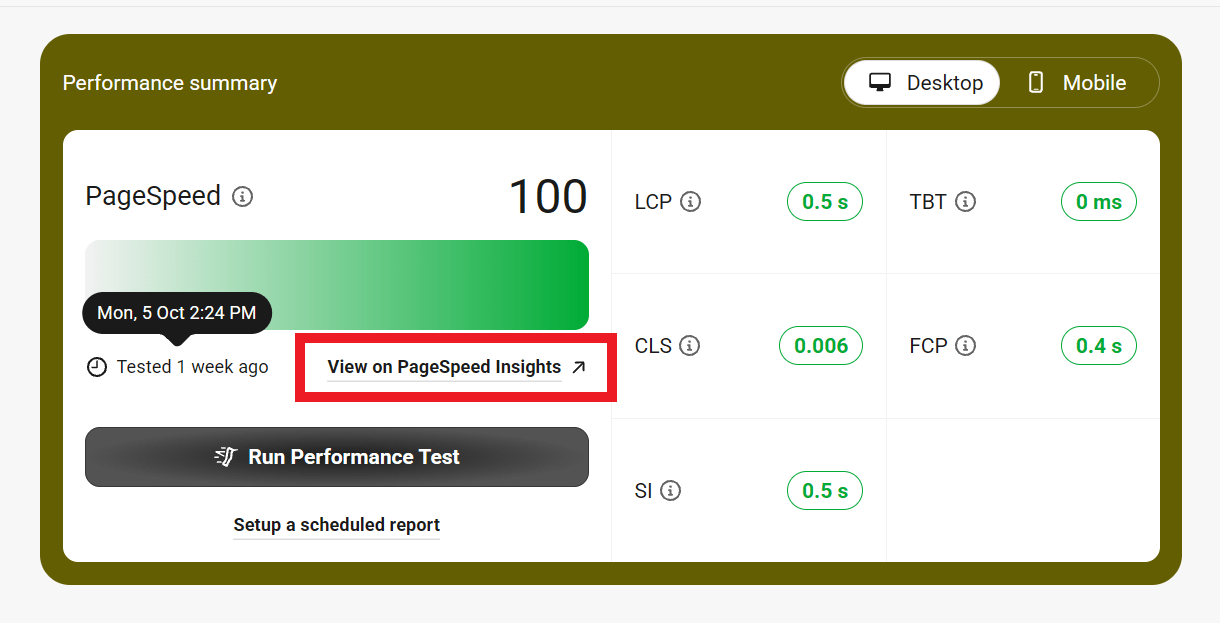
Click the View on PageSpeed Insights link (pre-encoded with your site URL and the desktop or mobile mode you selected above) to be redirected to the web.dev test page where you can get detailed performance test results and recommendations for improvement.
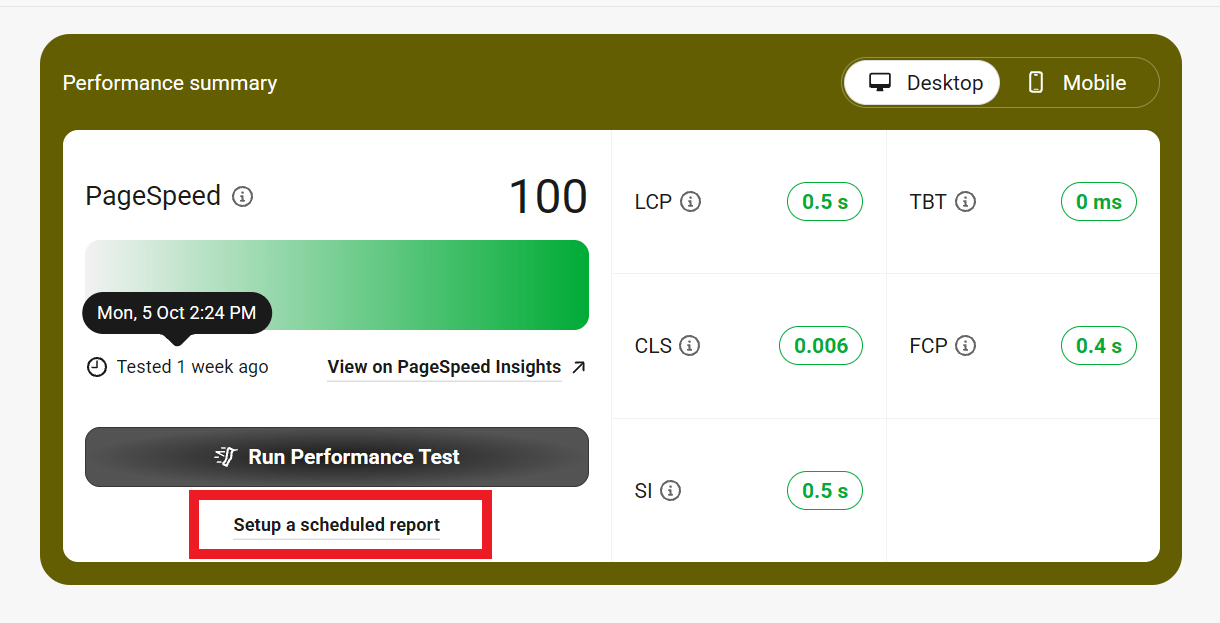
Click the Setup a scheduled report link to be redirected to the Reports & Alerts section under the Advanced tab where you can enable and manage notifications and regular reports for several Hummingbird features.
2.2.3 Quick Feature Controls
Link to chapter 2This section displays cards for key Hummingbird features, giving you a quick way to enable or disable each one directly from the Dashboard. Each card includes a brief description of the feature along with a gear icon that takes you to the feature’s configuration screen where you can manage its settings in detail.
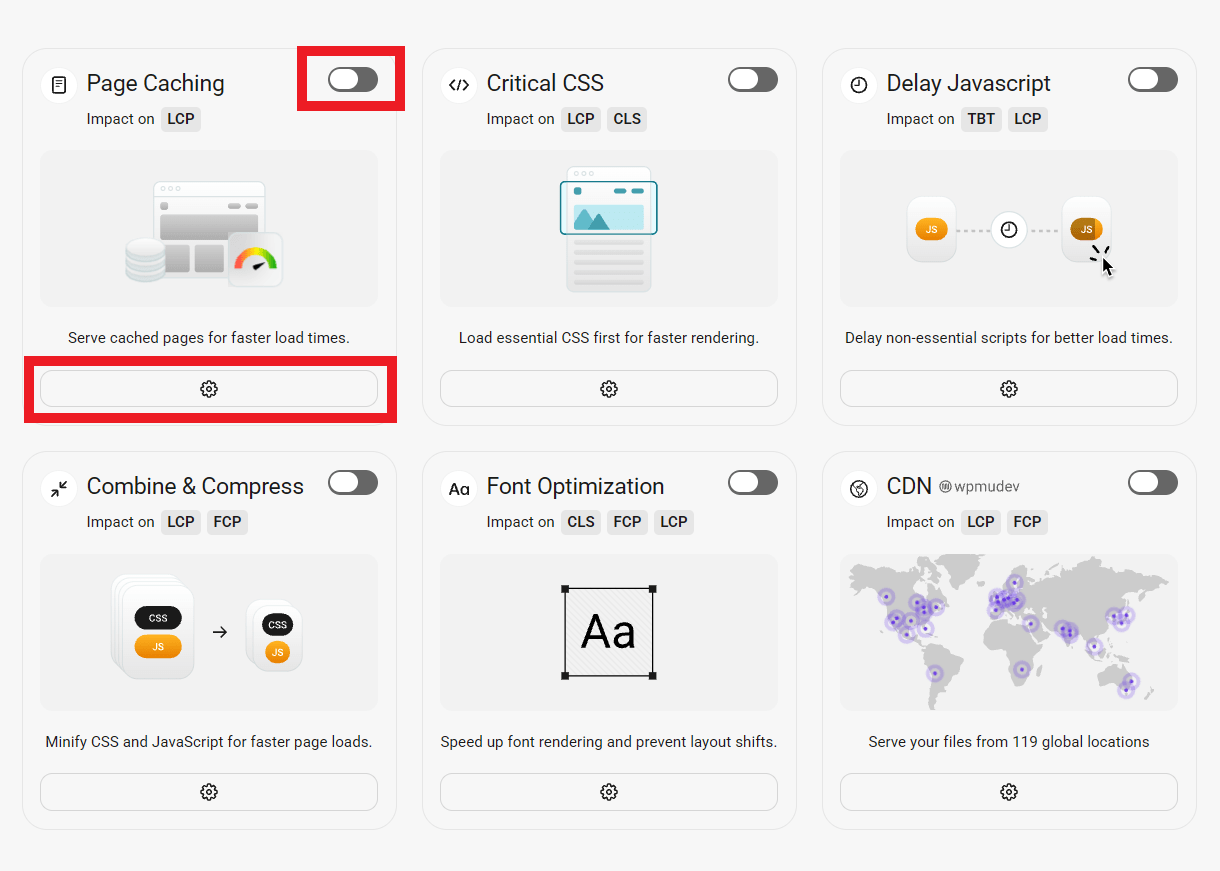
2.2.4 Score Metrics
Link to chapter 2As noted in the Performance Summary Panel chapter above, the summary includes the key metrics that affect your site’s overall performance score.
You can view detailed information about each of these metrics, and learn how they affect the performance of your site, when you click the View on PageSpeed Insights link in the summary panel.
According to this page at web.dev, the weighting of each metric is chosen to provide a balanced representation of a site visitor’s perception of performance.
Here’s a breakdown of each metric, and how it affects your overall performance score. Click any one to jump to the corresponding section in this document for more information about each:
- First Contentful Paint – 10%
- Largest Contentful Paint – 25%
- Total Blocking Time – 30%
- Cumulative Layout Shift – 25%
- Speed Index – 10% of your overall score
First Contentful Paint
The First Contentful Paint score reflects the amount of time it takes for any piece of visible content to render on the screen.This includes images, non-white textual elements and SVGs. Note that content delivered to the page in iframes does not affect this metric.
This metric is significant because users increasingly expect pages to load very fast and often associate slow loading pages with a lack of quality or professionalism.
This metric contributes to 10% of your overall performance score. For more information about this metric and how to improve it, see this page at web.dev.
Largest Contentful Paint
The Largest Contentful Paint score reflects the amount of time it takes for the largest image or block of text to fully render on the screen.
This is very similar to the First Contentful Paint metric above, but it better reflects user experience as it is a more reliable indicator of when the user sees your page fully loaded.
This metric contributes to 25% of your overall performance score. For more information about this metric and how to improve it, see this page at web.dev.
Total Blocking Time
The Total Blocking Time score reflects the total amount of time that a page is blocked from responding to user input. This includes mouse clicks, screen taps, or keyboard clicks.
Inefficient script loading, parsing or execution are some of the major factors that contribute to a high blocking time score.
This metric contributes to 30% of your overall performance score. For more information about this metric and how to improve it, see this page at web.dev.
Cumulative Layout Shift
The Cumulative Layout Shift score refers to the sum total of all individual layout shift scores. That’s any time an element changes its position while the page is still loading.
For example, this can happen when images or buttons load slower than the text, or when slow ad scripts cause ad content to be dynamically inserted into the content.
This metric contributes to 25% of your overall performance score. For more information about this metric and how to improve it, see this page at web.dev.
Speed Index
The Speed Index score reflects the average time it takes for content to appear on the visible screen, or “above the fold.” It is a bit of a composite score since there are multiple sub-tasks that impact how long that takes.
Additionally, factors outside the site admin’s control also impact the speed index, such as the types of devices accessing the site as well as their various screen sizes.
This metric contributes to 10% of your overall performance score. For more information about this metric and how to improve it, see this page at web.dev.
2.2.5 Safe Mode
Link to chapter 2Safe Mode allows you to test any optimization settings you’ve applied in Hummingbird without affecting your website visitors’ experience. When Safe Mode is enabled, only logged-in site administrators can see the optimized version of the site, while regular visitors continue to see the live, unoptimized version.
Since Hummingbird’s in-plugin performance test only runs on your live site, this gives you a safe environment to review and fine-tune settings, and test the configuration using the Safe Mode link in 3rd-party tools like PageSpeed Insights.
Safe Mode Activation
You can enable Safe Mode from any screen in Hummingbird. The toggle is always visible in the top header of the plugin interface.
Once active, a banner will appear at the top of the page giving you access to the main Safe Mode tools:
- Preview Changes: load a front-end preview of your site with your test optimization settings applied.
- Copy Test Link: generate a Safe Mode link for testing page speed.
- Review & Publish: review your changes before making them live.
The banner remains visible on all plugin screens while Safe Mode is active, allowing you to preview changes or disable the feature at any time.
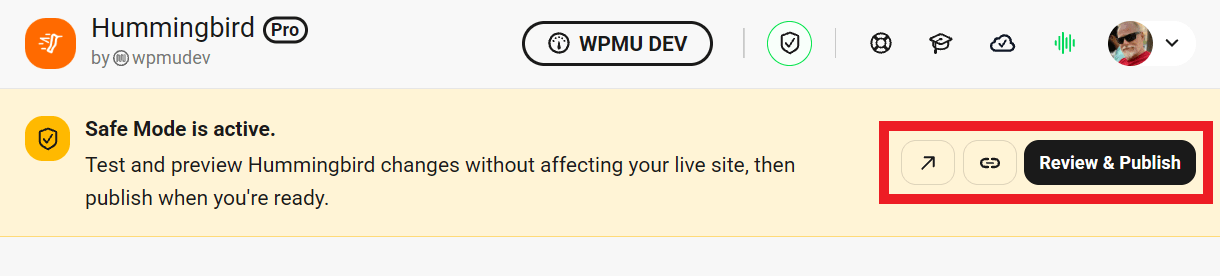
Safe Mode Workflow
With Safe Mode enabled, you can safely adjust and test your optimization settings across Caching, Asset Optimization, Advanced Tools and CDN without affecting your visitors’ experience. Any changes you make while Safe Mode is active apply only to your Safe Mode preview.
For best results, avoid making too many changes at once. Adjust one setting at a time and preview your site to confirm that it doesn’t introduce issues before moving to the next change. This approach helps you identify the exact source of any problem that may arise. Making many changes at once can make it difficult to determine which adjustment caused an issue.
Click the arrow icon to load a front-end preview of your site. This allows you to browse different pages and verify that your optimization settings don’t introduce visual issues, layout shifts, or JavaScript errors.
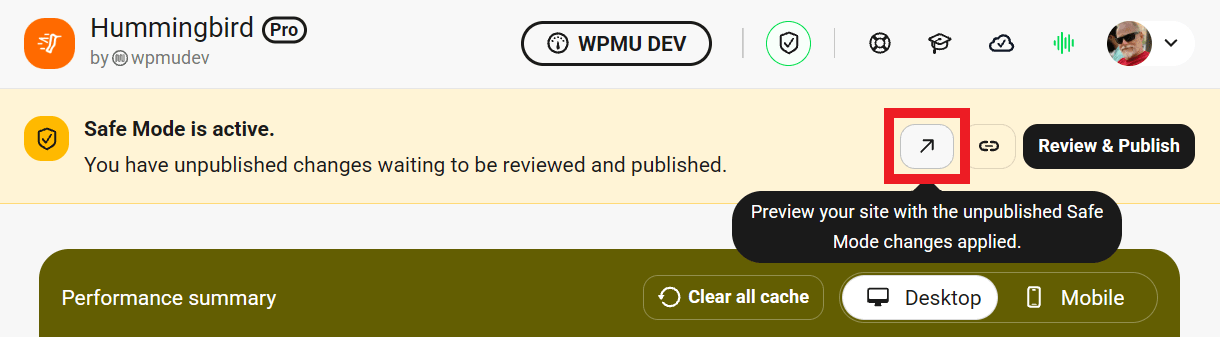
On the front-end, a notice will appear at the top of the page indicating that you are viewing the site in Safe Mode preview.

If any settings you applied cause problems, such as broken elements, style issues, or slower performance, click Back to Hummingbird to return to the dashboard and continue adjusting your configuration.
To check how your configuration performs in third-party testing tools, click Copy test link in the front-end banner or the link icon in the plugin banner.
Paste the link into tools like Google PageSpeed Insights, GTmetrix, or Pingdom to test your optimization settings before publishing them live.
Once you’re satisfied with how your site looks and performs in Safe Mode, click Review & Publish. A modal window will pop up in the Hummingbird Dashboard with all the changes you’ve made so you can double-check things before hitting the Publish Changes button. We recommend that you also enable the option to Clear cache after publishing changes.
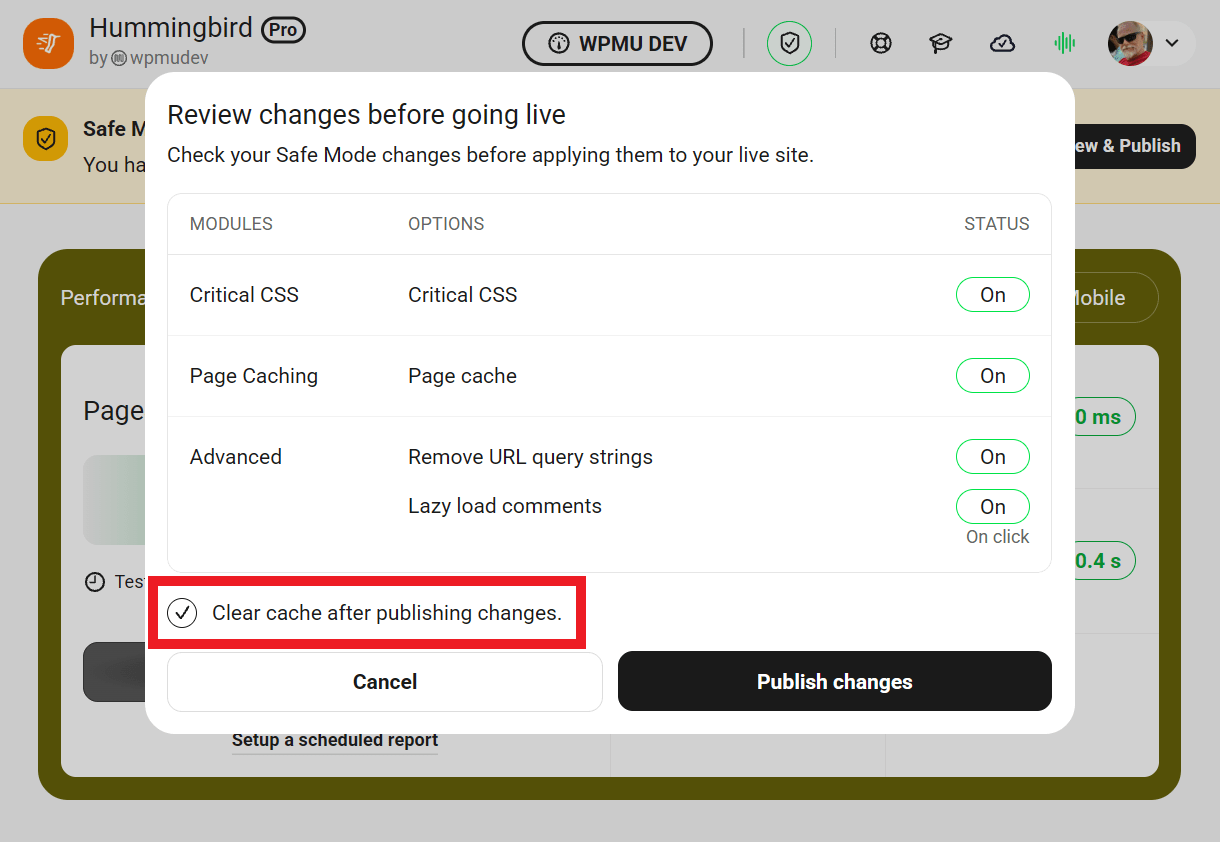
After you’ve completed your testing and published your changes, disable Safe Mode. Leaving it enabled for extended periods may slow down your live site.
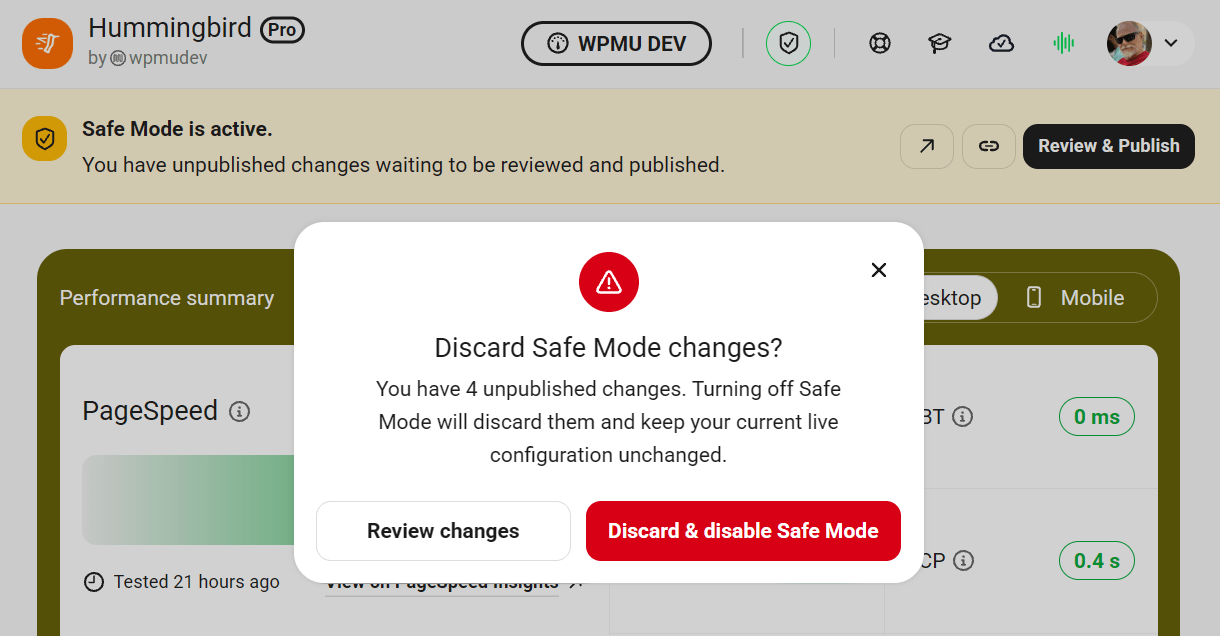
If you turn off Safe Mode without publishing your changes, a confirmation modal will appear. This reminder lets you choose whether to review the changes you made in Safe Mode or discard them and disable the feature.
Performance Tests in Safe Mode
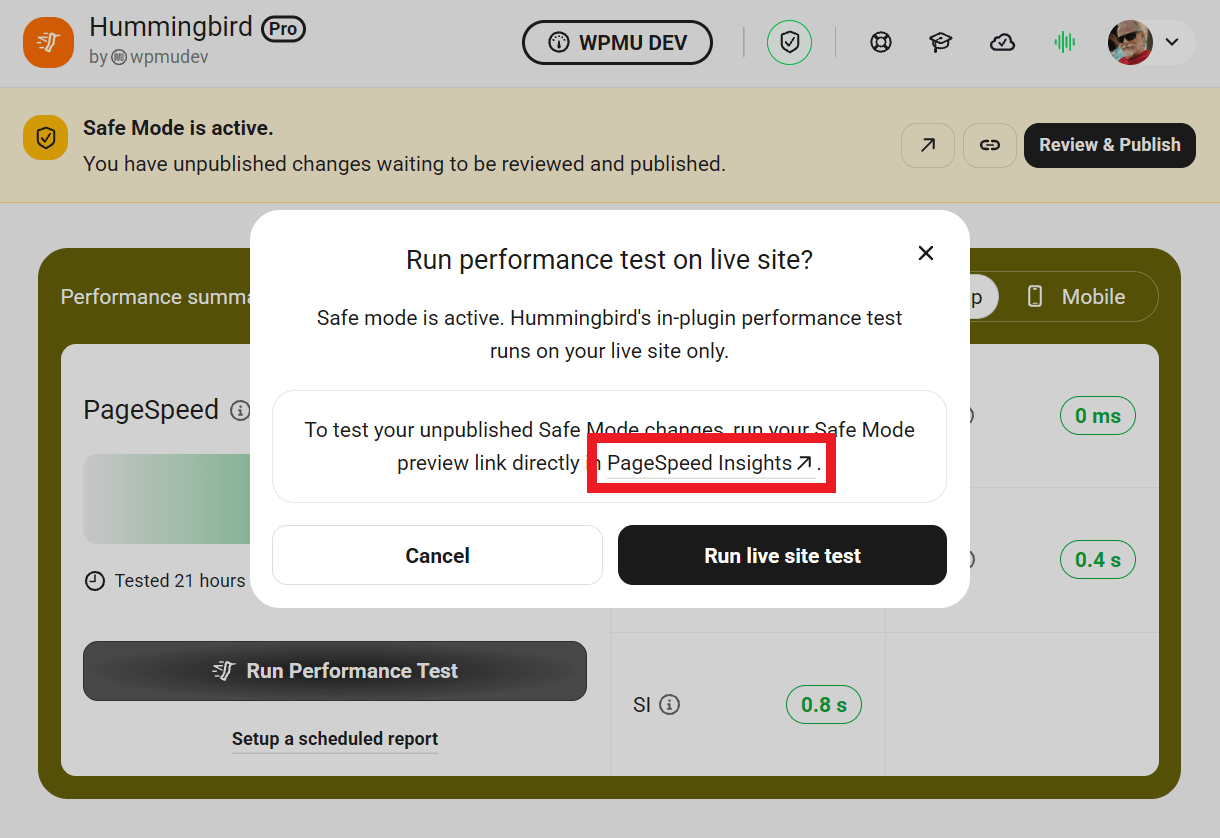
When Safe Mode is enabled, Performance Tests do not use your Safe Mode optimization settings. Instead, any new test you run from the Dashboard screen is performed using your current live optimization configuration.
To evaluate the impact of your Safe Mode changes on your site’s performance score, copy the test link from the Safe Mode banner and paste it into any 3rd-party testing tool. Or click the pre-encoded PageSpeed Insights link in the modal that will pop up if you click Run Performance Test in the Dashboard when Safe Mode is enabled.
2.3 Asset Optimization
Copy chapter anchor to clipboardAsset Optimization is where Hummingbird makes applying advanced performance enhancements as easy and efficient as possible by identifying HTML, Javascript and CSS files which may be compressed, combined or moved to improve performance.
Asset optimization can be utilized in two different modes:
- Automatic – Combine and compress your assets and improve page load times based on our automated options.
- Dev Mode – Manually configure each file yourself to achieve the exact setup that you require for your site.
WPMU DEV Managed Hosting servers run the HTTP/2 protocol which automatically optimizes the delivery of your assets. You can still combine and move your files, but don’t expect huge improvements, as we have already squeezed all the speed we can out of these assets.
Please note that Hummingbird’s Asset Optimization engine cannot negotiate a site that is password-protected with a HTTP Auth form. You’d want to disable that before running Asset Optimization on your site.
2.3.1 Combine & Compress
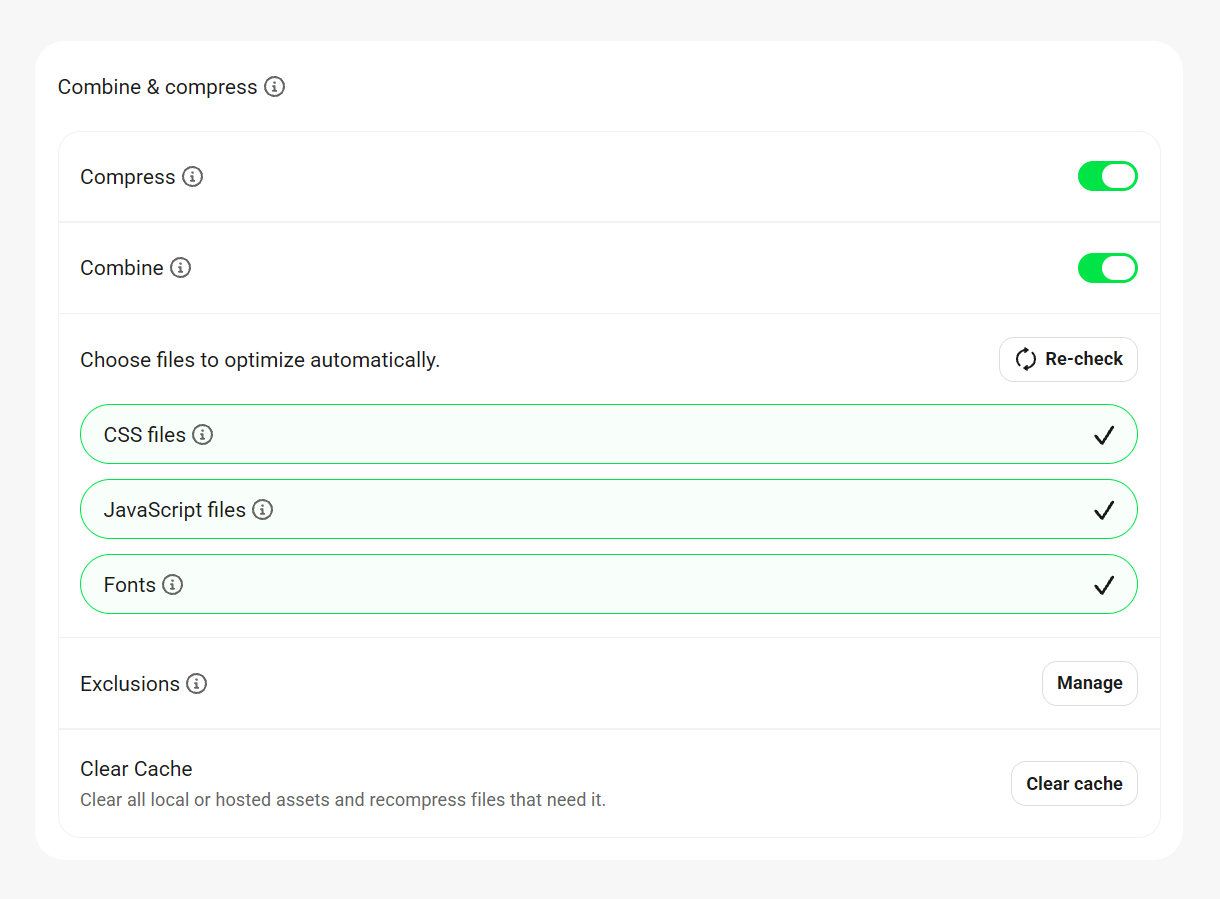
Link to chapter 3The Combine & Compress options are all you need to configure for the Automatic Optimization feature. It’s is a great way to reap the rewards of Asset Optimization without the hassle of doing a whole manual configuration in Dev Mode.
Compress
Enable this option to reduce the file size of your CSS and JavaScript files by removing unnecessary characters and whitespace. It improves delivery speed by decluttering your assets.
Combine
Enable this to combine multiple JS and CSS files into fewer files to reduce the number of requests made when a page is loaded, helping improve overall performance.
Choose files to optimize automatically
Choose whether you want to optimize CSS files, JavaScript files and/or Fonts. If you’ve added or removed plugins or themes, click the Re-check button to update the file list and ensure the latest assets are included in optimization.
Exclusions
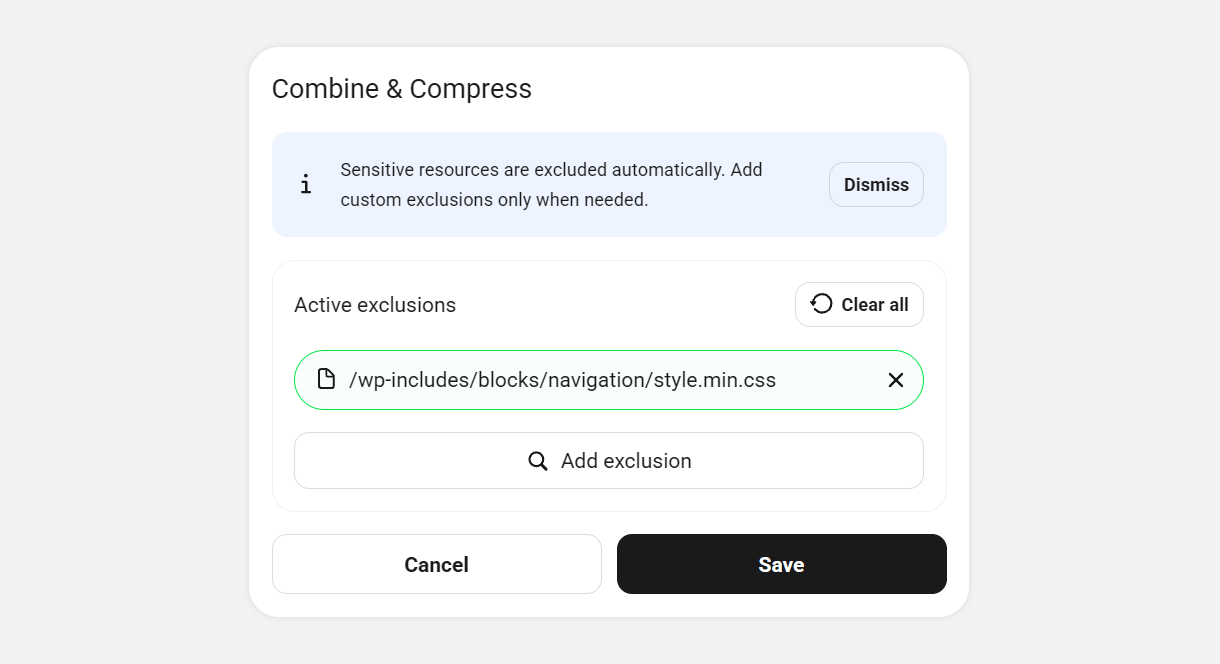
If there are any files that you want to exclude from optimization, they can be listed here and they will be left as-is. Click the Manage button, then click Add exclusion to list & locate the files you want to exclude.
Clear Cache
Click to clear all local or hosted assets. Files will recompress the next time site pages are loaded. See also Clear cache shortcut in Settings > Others.
2.3.2 Font optimization
Link to chapter 3The Font Optimization options enable you to customize how custom fonts are served to your users’s browsers to enhance site performance, page speed, and the user experience.
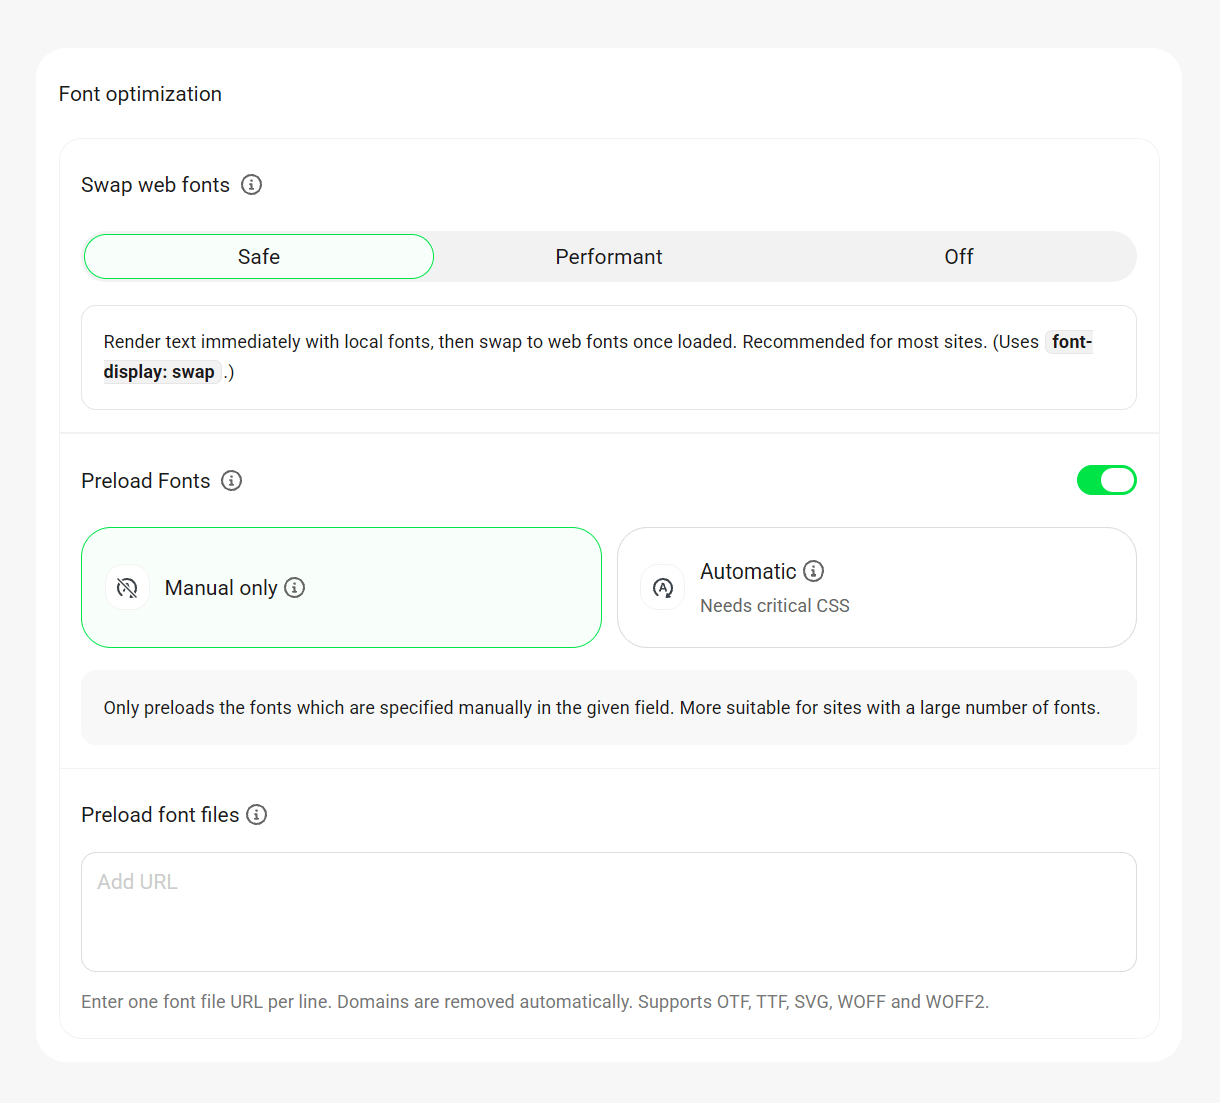
Swap Web Fonts
Enable this feature to swap out web fonts and render similar system fonts until the actual font is loaded and ready to render. It will also automatically combine multiple font files to reduce http requests. You can choose either of the following font display methods.
- Safe (Recommended) – If this method is selected, all custom fonts used on the site will be swapped out with locally available system fonts on the site visitor’s device using the
font-display: swapCSS attribute. - Performant – In this method, the site visitor’s browser will wait 100 ms for the custom fonts to load before displaying the text. But it will fall back to the user’s system fonts if the loading takes any longer. It uses the
font-display: optionalCSS attribute.
This method will help reduce any Cumulative Layout Shift (CLS) caused by textual elements, but it may result in unstyled text on slower network connections. Hence, the Safe method is recommended for most sites, unless you are facing CLS issues. - Off – Disable font swapping. Web fonts will load normally without any font-display strategy applied.
Performance Impact
- The usage of the
font-displayCSS attribute helps resolve the Ensure Text Remains Visible during Webfont Load audit on Google PageSpeed Insights. - The TTFB, Load Delay, and Load Time phases of LCP may also improve if the LCP candidate is a textual element.
Filters
- You can change the attribute from swap/optional to block, auto, or any other valid value using the
wphb_google_font_displayfilter. - Combining font files can be disabled by using the
wphb_disable_google_font_combinefilter.
See Font Optimization Filters below for details.
Preload Fonts
Enable this feature to instruct your user’s browser to preload fonts which are critical for the above-the-fold rendering, to avoid font loading delays during the rendering process and the first paint. All the key fonts will be preloaded using the rel="preload" attribute.
- Manual – Enable this option if your site uses a large number of web fonts and you wish to manually specify the fonts to be preloaded. The font URLs can be added in the Preload font files field, one per line.
- Automatic (Pro only) – This method requires the Critical CSS feature to be enabled to work correctly. It automatically fetches all the essential fonts within the generated critical CSS and preloads them, saving you the manual effort.
In addition, the fonts you specify manually in the Preload font files field will also be preloaded in the Automatic method.
Performance Impact
- Adding the
rel="preload"attribute to the critical fonts on a page helps with the Resolve Preload Key Requests audit when it’s failing because of font elements. - It can also help resolve FOIT, FOUT, and the resulting CLS issues, especially when used in combination with the Swap Web Fonts feature.
- The TTFB, Load delay, and Load Time phases of LCP may also improve if the LCP candidate is a textual element.
- The Automatic option works best with the Above-the-fold method for Critical CSS. When using the Full-Page method, it would preload all the fonts used on a page instead of just the above-the-fold ones, and this may result in performance regressions, especially on sites with a large number of fonts.
Preload font files
Optional – Manually specify font file URLs to preload on every page. Enter one font file URL per line. Domains are removed automatically. Supports OTF, TTF, SVG, WOFF and WOFF2.
Font Optimization Filters
- wphb_add_preload_to_font_used_css – Use to disable the automatic extracting of fonts to preload and manually specify those fonts in the UI instead.
- wphb_allowed_preload_fonts – Filter to add/remove font types to be preloaded.
- wphb_google_font_display – Filter to change the font-display attribute from the default swap to optional, auto or any other valid value.
- wphb_google_fonts_domain – Filter to change the google font domain to bunny font domain or any other equivalent.
- wphb_disable_google_font_combine – Filter to disable automatic combination of multiple font files to reduce http requests.
- wphb_generated_used_css – Use to help resolve possible 404 errors related to fonts when the Critical CSS feature is enabled.
2.3.3 Critical CSS Pro
Link to chapter 3The Critical CSS feature enables you to drastically reduce your page load time and eliminate render-blocking resources by automatically generating the critical CSS required to load your above-the-fold content. Note that this applies only to not-logged-in site visitors; the logged-in user experience is not affected.
If you ever need to clear the CSS cache and regenerate the critical CSS for all selected post types and taxonomies, click the Regenerate Critical CSS button.
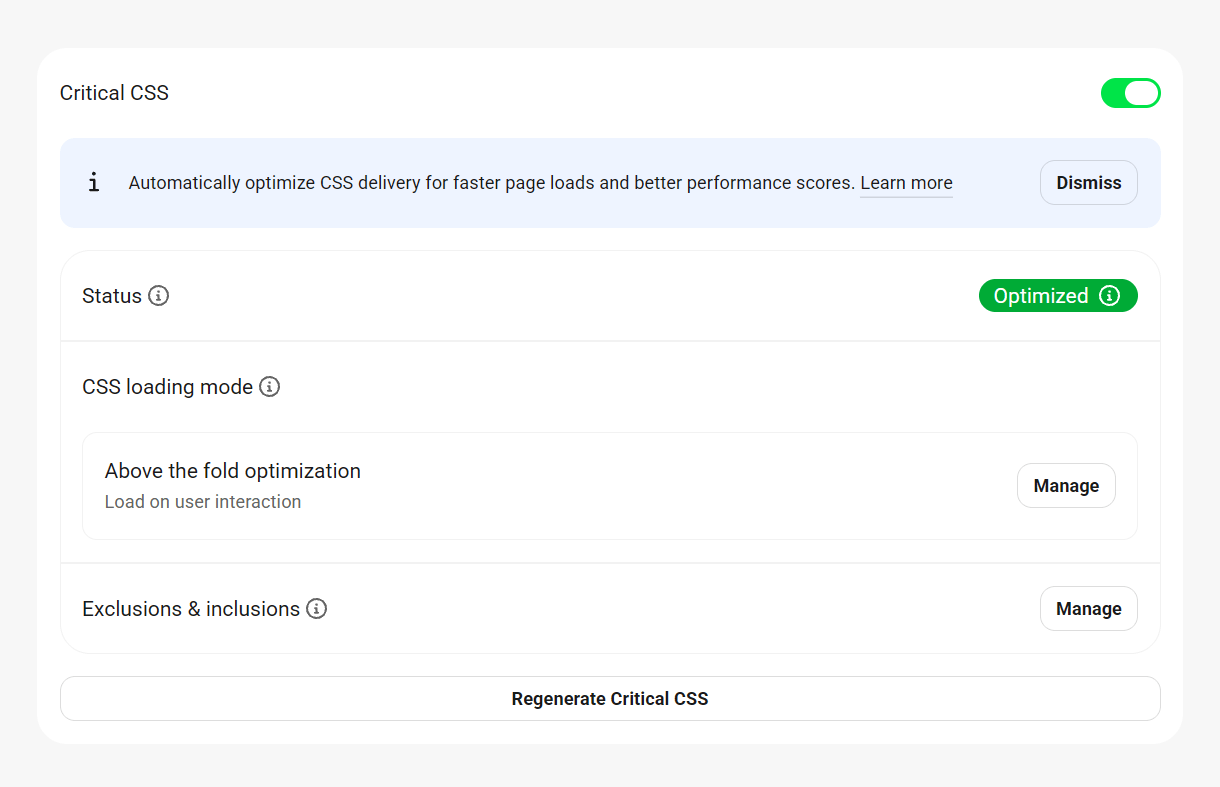
Once the feature is activated, click the Manage button in CSS loading Mode choose how your critical CSS should be generated and loaded.
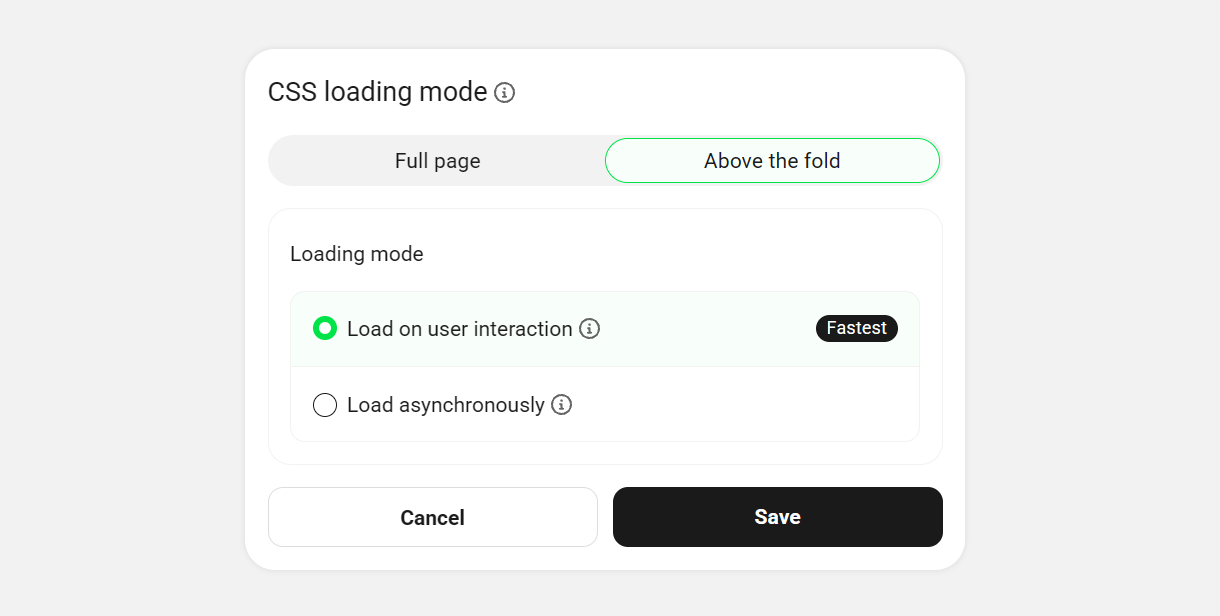
- Full-Page CSS Optimization (Recommended) – Inline all CSS used on the page, and either delay or remove the rest (see below). This option helps to resolve render-blocking and unused CSS issues that may be reported in a Performance Test.
- Above-the-Fold CSS Optimization – Inline above-the-fold CSS, and load the rest asynchronously. This option also helps to resolve unused CSS issues
If you select the Full-Page loading option, you can also choose how the rest of the CSS should be loaded:
- Load On User Interaction – The rest of the CSS loads instantly as soon as there is any user interaction on the page (mouse, tap or keyboard).
- Remove Unused – Any CSS not used on the specific page is not loaded at all.
If you select the Above-the-fold loading option, you can also choose how the rest (below-the-fold) of the CSS should be loaded:
- Load On User Interaction – The rest of the CSS loads instantly as soon as there is any user interaction on the page (mouse, tap or keyboard).
- Load Asynchronously – Any CSS not used on the specific page will be loaded in the background without blocking the rendering of the webpage.
Exclusions & Inclusions
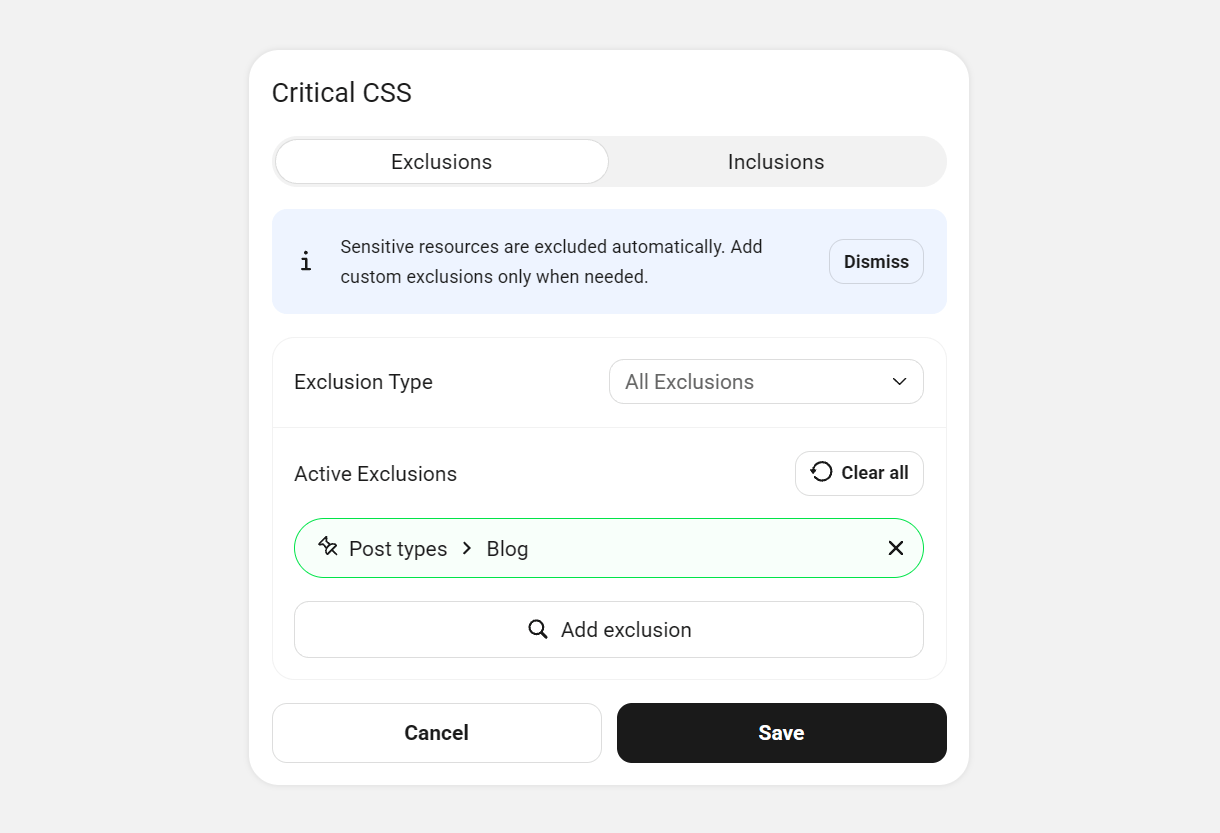
Regardless of the loading method selected above, you can specify the type of objects for which critical CSS shouldn’t be generated. Click the Manage button in Exclusions & inclusions, then select the Exclusion type: Files, Post Types, Post URLs, Plugins, Themes, and Keywords
Finally, click Add exclusion to select the specific objects to exclude, and click Save.
Users developing their own themes can use the define('WPHBDONOTOPTIMIZE', true); constant to prevent Critical CSS from being generated on specific pages or templates.
Manual Inclusions
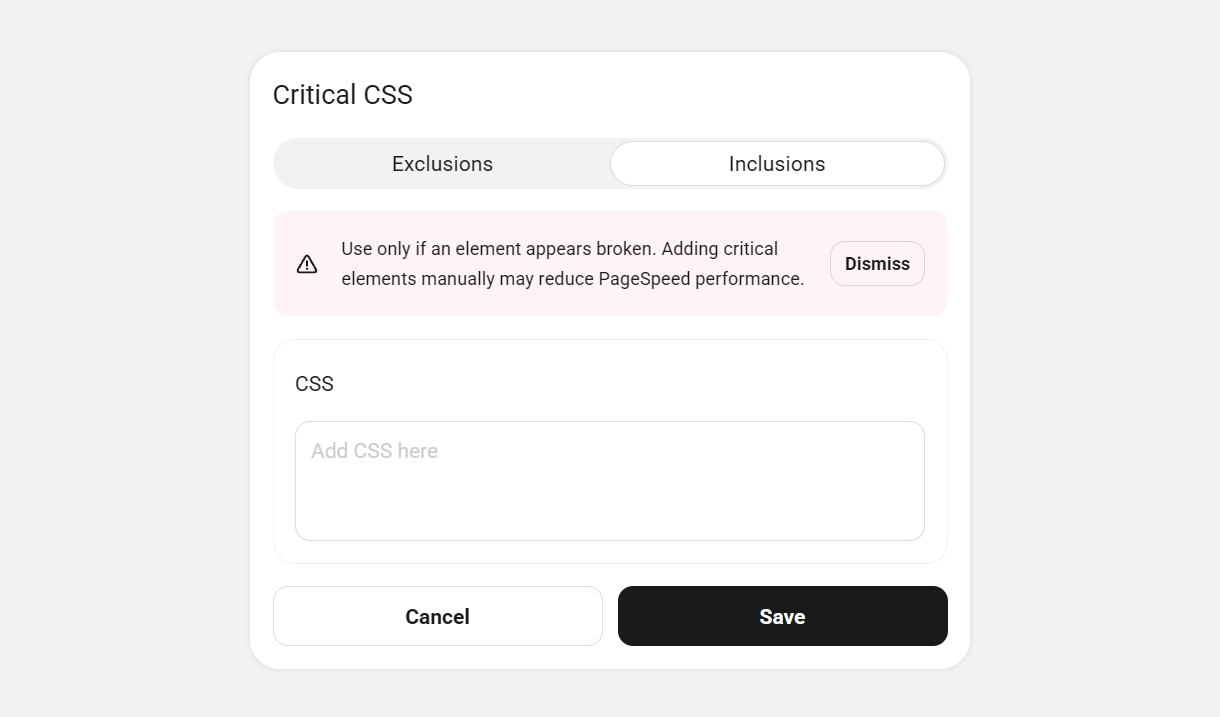
Also regardless of the loading method selected, you can choose to include any manual CSS rules you deem necessary by adding them in the Manual Inclusions textarea. They will be included on all post types selected above.
Gutenberg Options
Once the Critical CSS feature is active, you’ll find additional options in the sidebar of the post/page editor for every post type you have not excluded above.
Click the Generate CSS file button for any post or page where critical CSS has not yet been generated.

If critical CSS has already been generated for a particular page or post, you’ll see options to either Regenerate the CSS file or to Revert back to the default CSS file for that specific page or post if needed.

How to Confirm Critical CSS Generation
You can check to confirm that Critical CSS has indeed been generated for a specific post, page or taxonomy by viewing the page’s source code or by popping open your browser’s developer tools. Then look in the <head> container where you’ll find the critical CSS in a <style> tag with an ID that corresponds to the content type.
For example:
- Frontpage critical CSS –
<style id="wphb-used-css-frontpage"> - Any single post –
<style id="wphb-used-css-post"> - Any category –
<style id="wphb-used-css-category">

Error Handling
The Critical CSS will be generated for all valid CSS, and if the feature encounters an invalid CSS, it will display an error message to inform you of the issue(s) so you can fix it and try again.
For example, if CSS generation is aborted due to invalid CSS syntax in a stylesheet, the error will indicate which CSS rule needs to be corrected, and would look something like this:
Error: The CSS for the URL https://coolsite.tld/newwp2/category/uncategorized/?hb_doing_critical=1 has a syntax error. Please check this section in your CSS: .is-IE .post-thumbnail /.wp-post-image
A similar error message would appear in the Gutenberg editor if CSS generation failed there.
To find exactly which stylesheet contains the malformed CSS:
- Copy the URL indicated in the error message.
- Paste that URL into the Address field here, and click the Check button: https://jigsaw.w3.org/css-validator/
- The validator will indicate the location of the problematic stylesheet so you can fix the issue, or contact support if you need help.

2.3.4 Delay JavaScript Pro
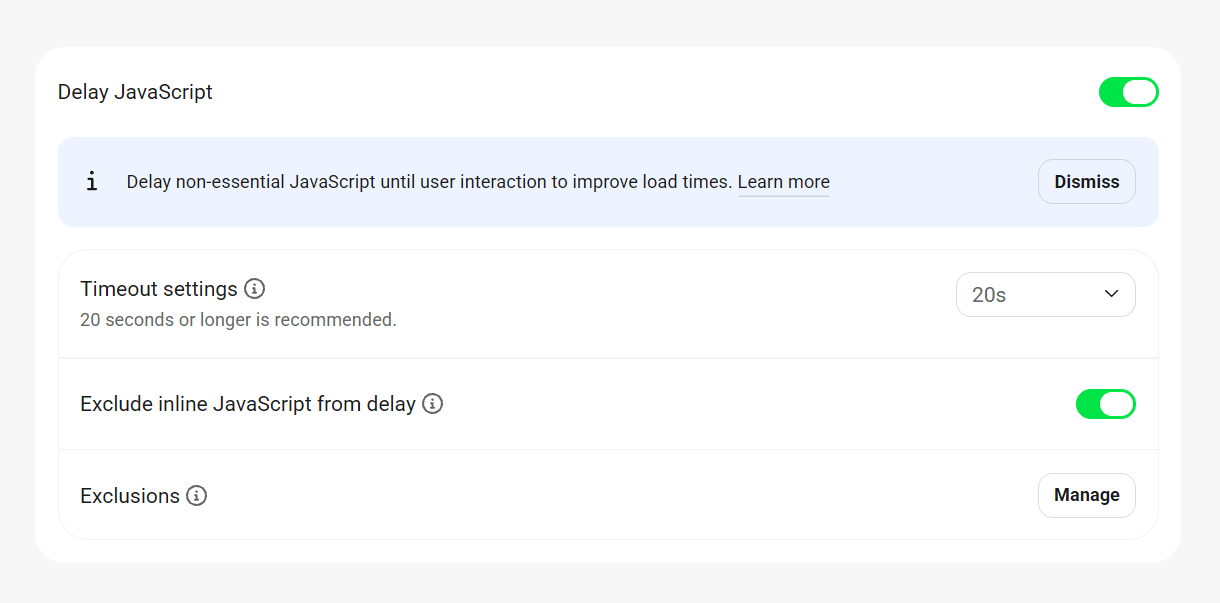
Link to chapter 3Enabling the Delay JavaScript feature delays the loading of all non-critical JavaScript files and inline scripts above the fold until any user interaction, like mouse movement, keyboard action, or screen tap. This improves the page speed and enhances the overall performance of the site.
Timeout settings
Specify a timeout (in seconds) after which the scripts will load automatically if no user interaction is detected. The recommended default is 20 seconds.
Exclude inline JavaScript from delay
Enable this option if you have critical inline scripts that need to execute immediately for proper page functionality.
Exclusions
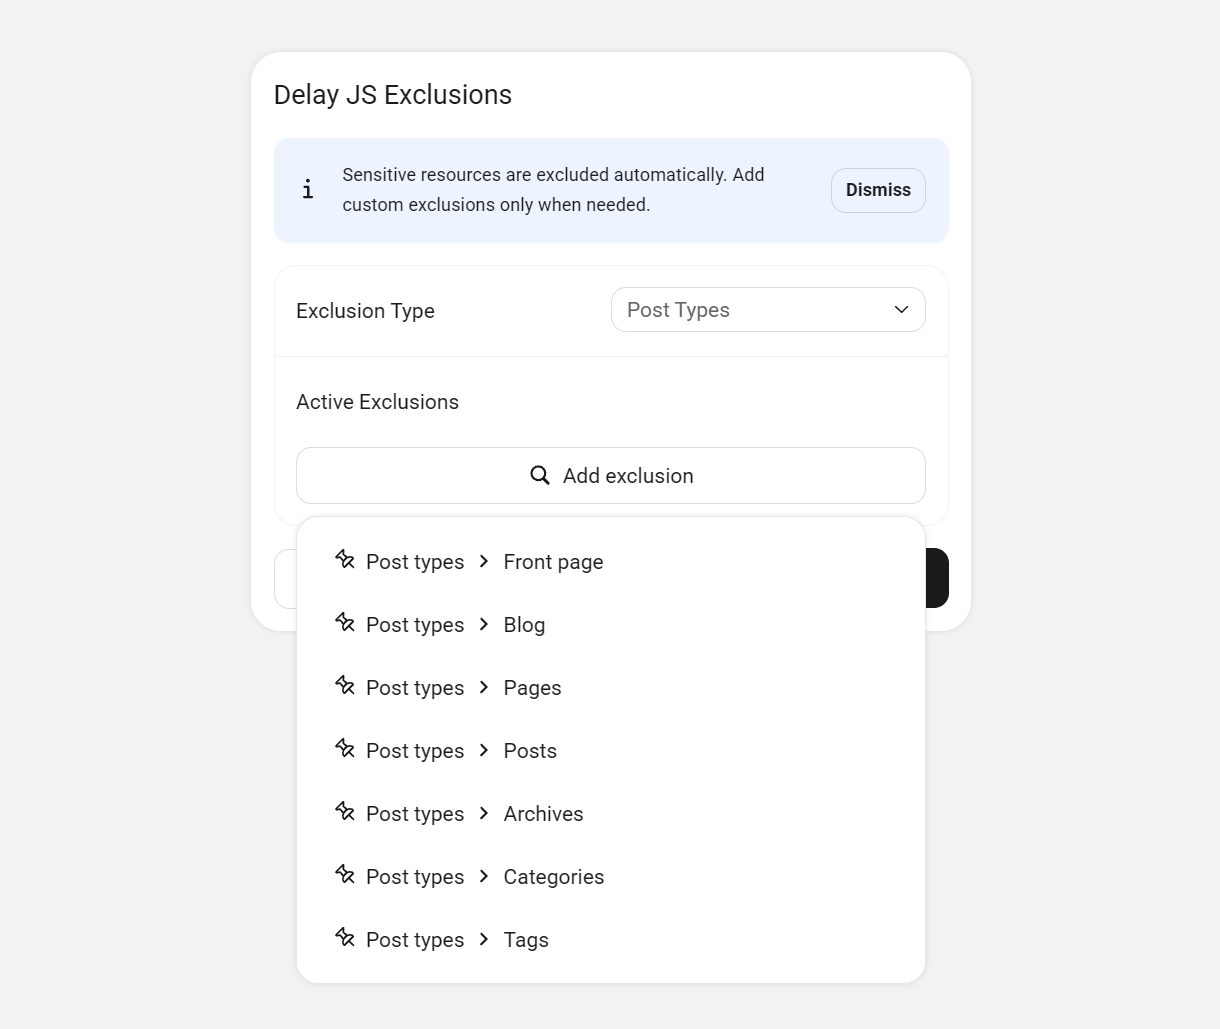
Here you can mention the specific types of objects that need to be excluded from delayed JS processing.
Click the Manage button, then select the type of object to exclude from the Exclusion Type dropdown: Files, Post Types, Post URLs, Plugins, Themes, Keywords, or Ads/Trackers.
Once you select an exclusion type, click Add exclusion to select the specific objects to exclude, and click Save.
2.3.5 Text Compression
Link to chapter 3This feature compresses your webpages and style sheets before sending them to your visitors’ browsers, which makes for faster loading times.
When the feature is active on your site, a status panel will appear indicating the compression method and which file types are being compressed.
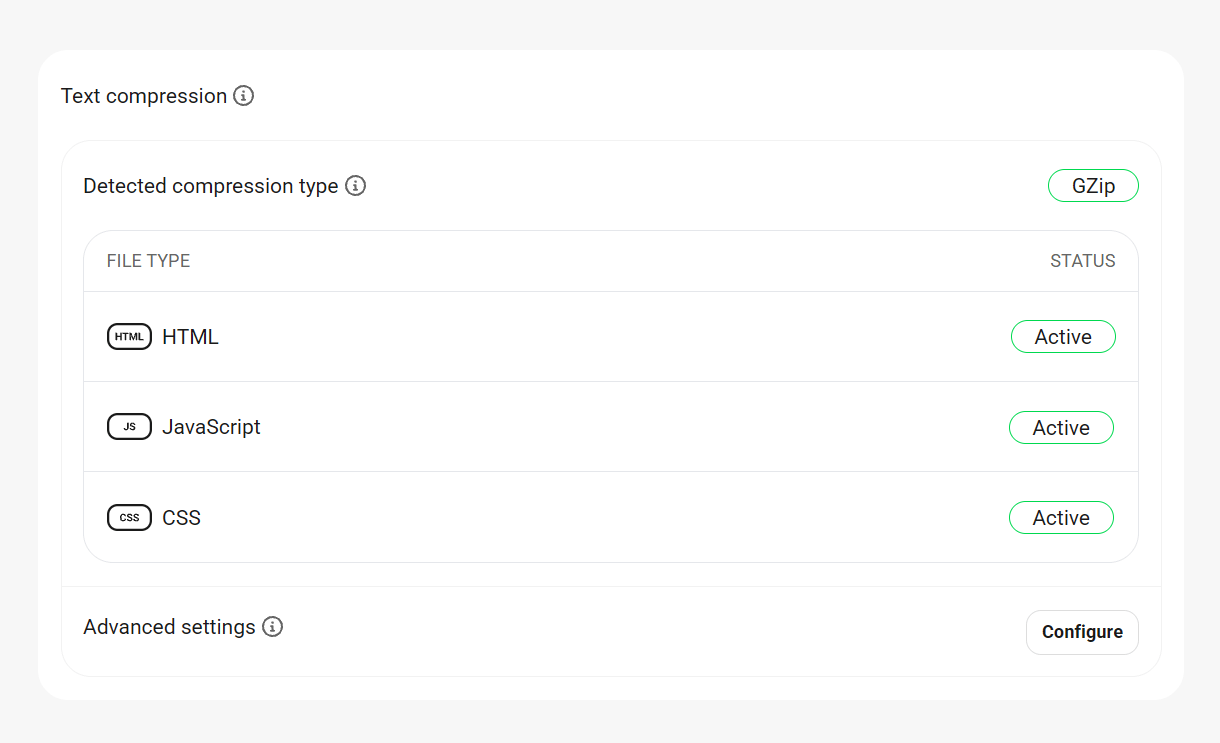
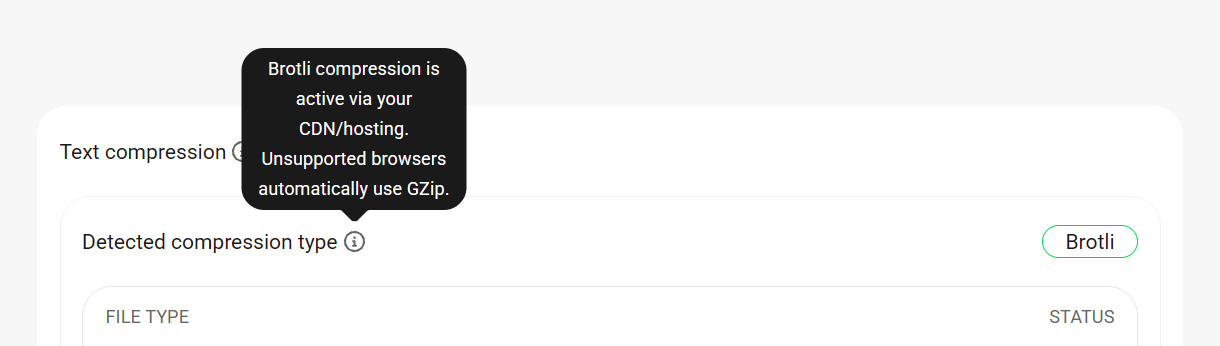
The more performant Brotli compression method is configured by default on all WPMU DEV hosted sites, and no further action is needed. If Brotli is not supported by a user’s browser, compression will fall back to Gzip. You’ll find more information about this in the Content Compression chapter of our Hosting > Getting Started document.
If Gzip compression is not yet active on your site, the process of enabling it will vary slightly depending on the type of server your site is running on.
Click the Configure button at the bottom, select your server type, and then follow the steps to enable compression. If you do not have access to or are uncomfortable modifying your site’s file system, we recommend contacting your host for assistance.
Apache/LiteSpeed
Hummingbird can automatically modify the files necessary to enable Gzip on an Apache or LiteSpeed server. Select the Apache/LiteSpeed server type from the dropdown menu and click Apply rules under the Automatic tab.
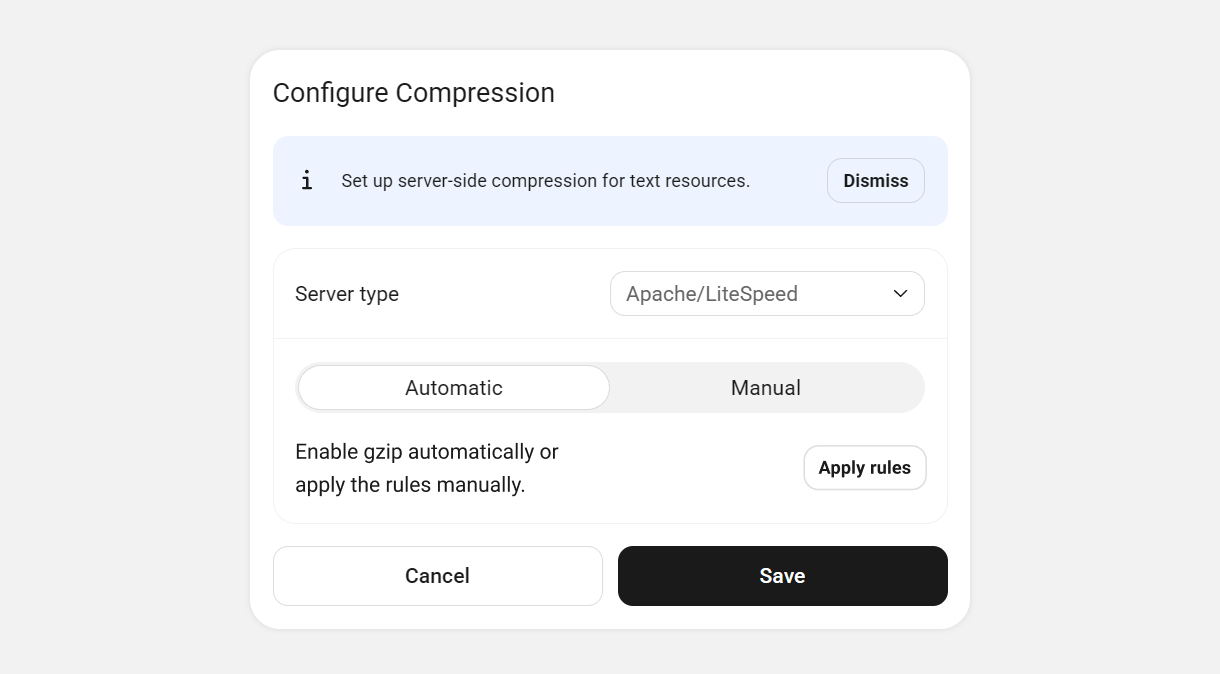
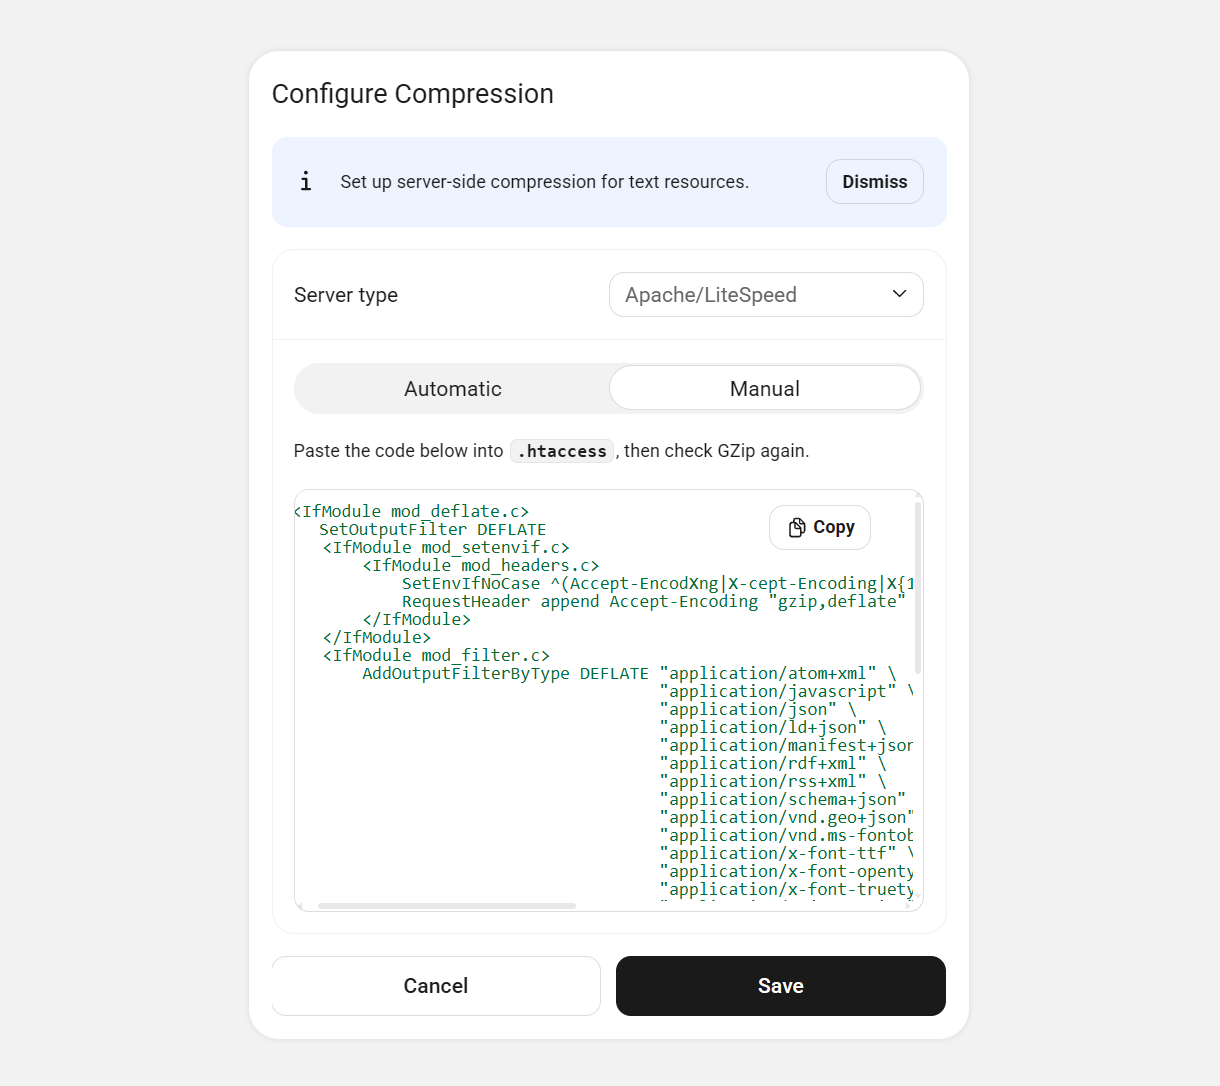
If you want to apply the code yourself, select Manual and Hummingbird will display the code that must be pasted into the .htaccess file to enable Gzip.
NGINX
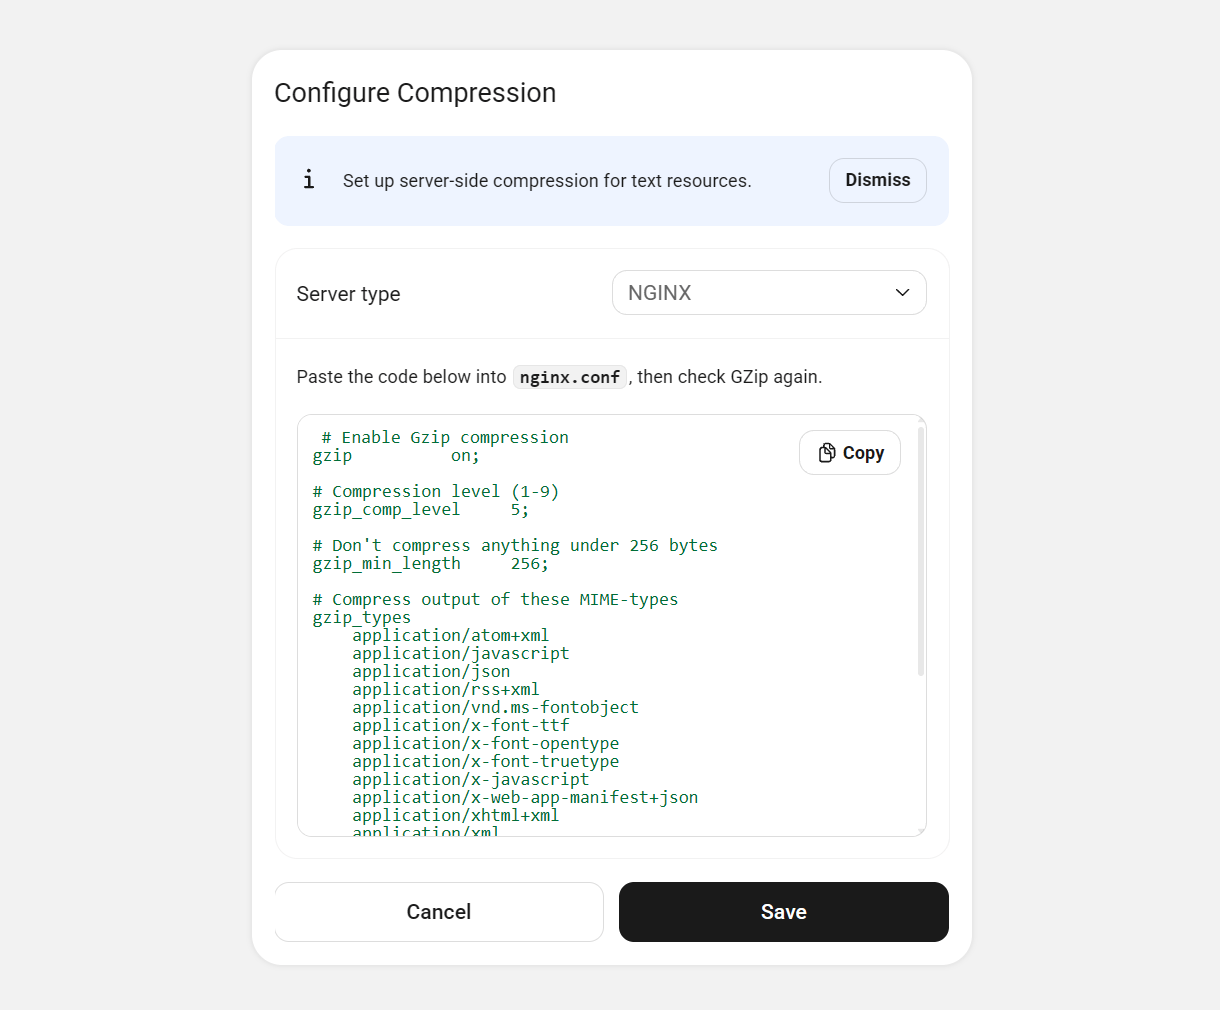
NGINX servers will not allow Hummingbird to edit the required files, so the code necessary to enable Gzip must be added to the server configuration file manually. Hummingbird will provide the code that must be pasted into the nginx.conf file, typically located here: /etc/nginx/nginx.conf or here /usr/local/nginx/conf/nginx.conf
IIS
IIS refers to any one of several Microsoft server types. Refer to the Microsoft IIS guidance page for help configuring Gzip.
Brotli Compression
If you have enabled the WPMU DEV CDN, your optimized files will be served with the more performant Brotli compression method instead of Gzip to browsers that support it.
The tooltip in Detected compression type will remind you of this.
2.3.6 Dev Mode
Link to chapter 3DEV Mode is a great way to handpick which files to target and it allows you to fully customize your optimization.
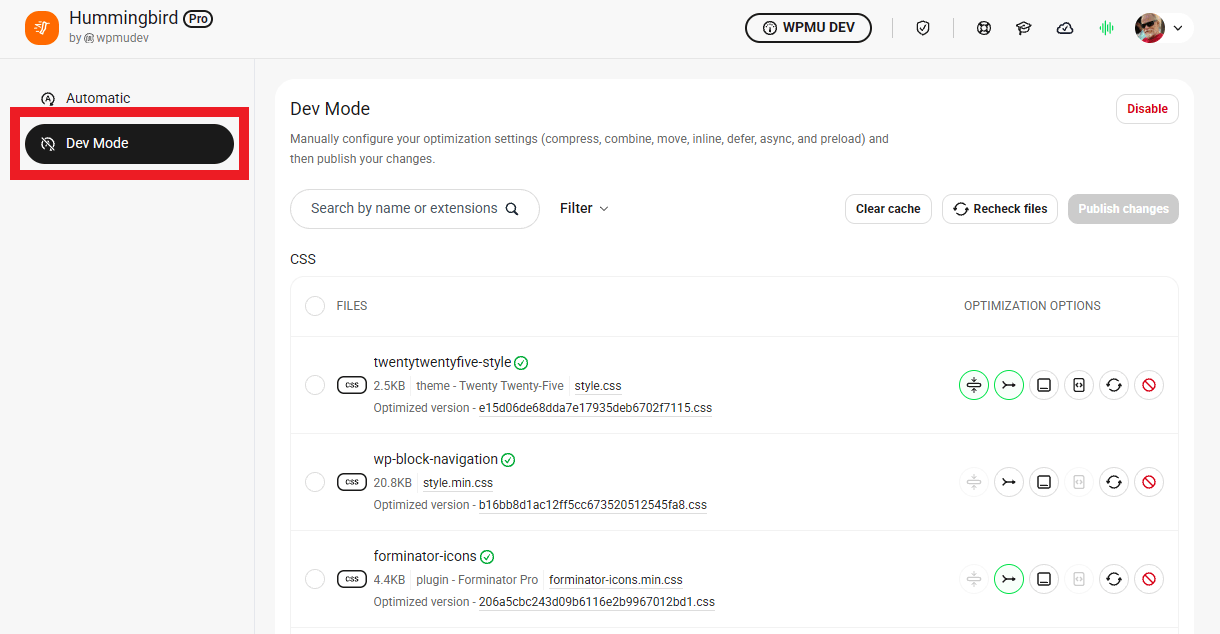
Dev Mode must first be enabled under Settings > Others. You’ll then see two tabs under Asset Optimization: Automatic and Dev Mode
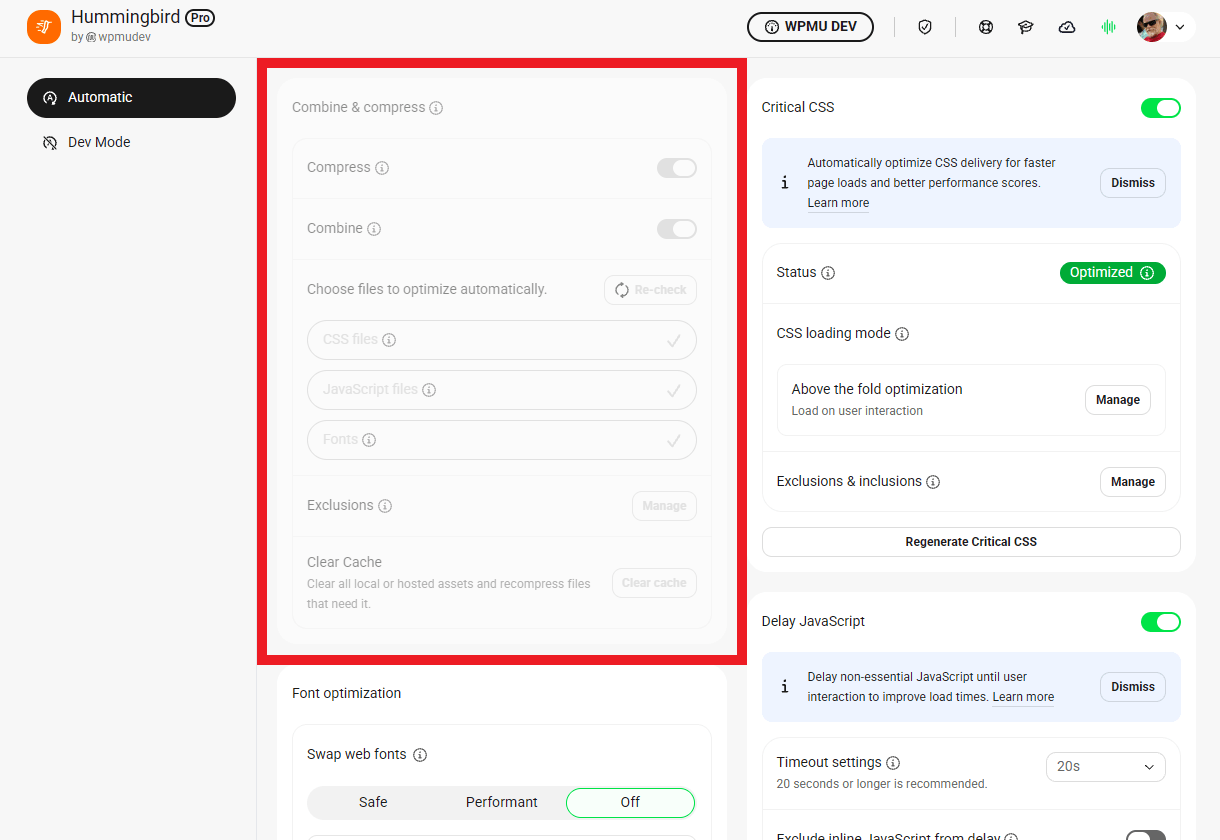
Dev Mode overrides the Automatic Combine & Compress settings, which will be greyed out and rendered inaccessible. All other options under that tab will remain functional however.
Main Tools
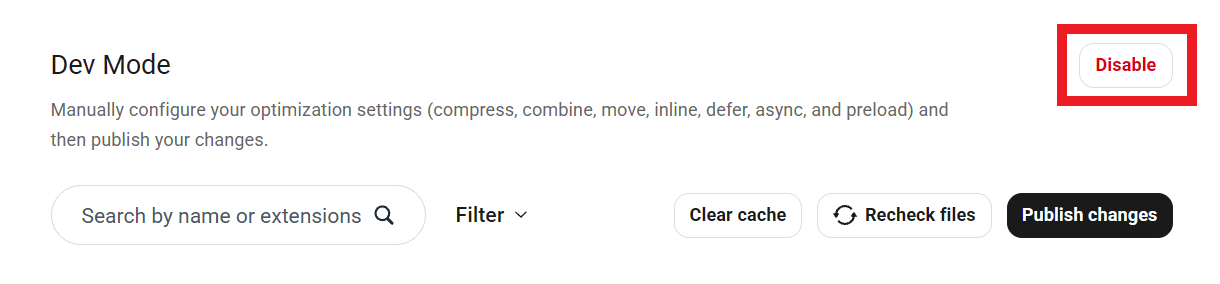
At the top of the Dev Mode screen, you’ll find several management tools.
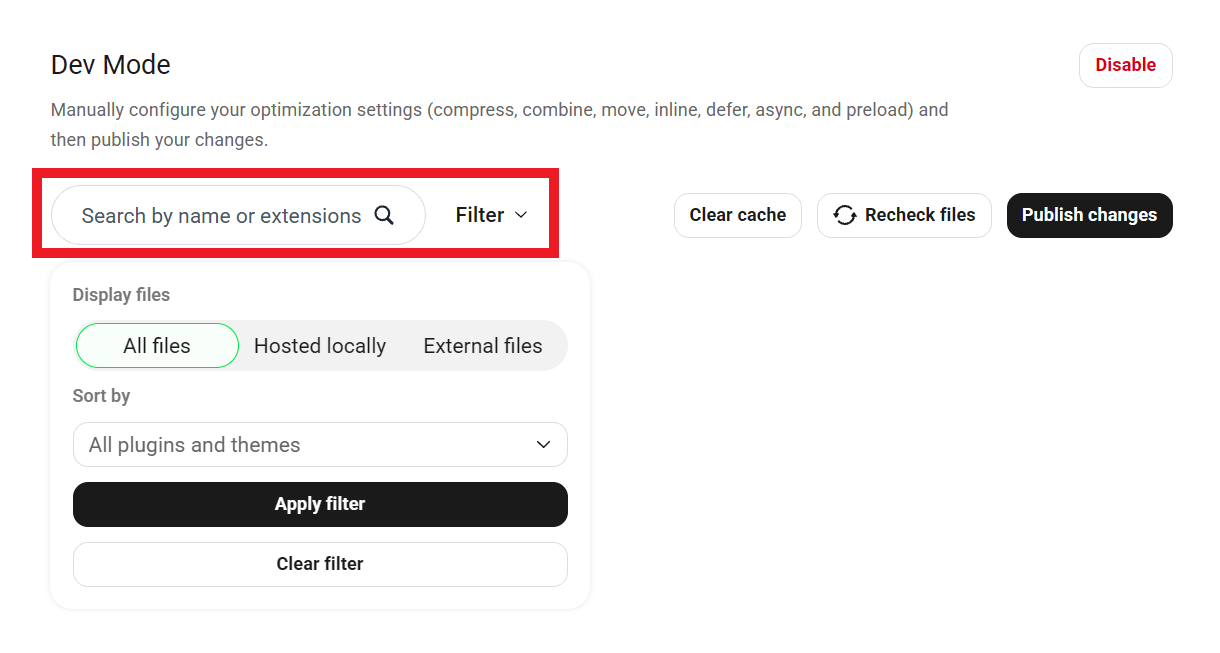
You can Filter the file list to show only those from a specific plugin or theme, either hosted or external files, or search for the file you want to optimize by name or extension.
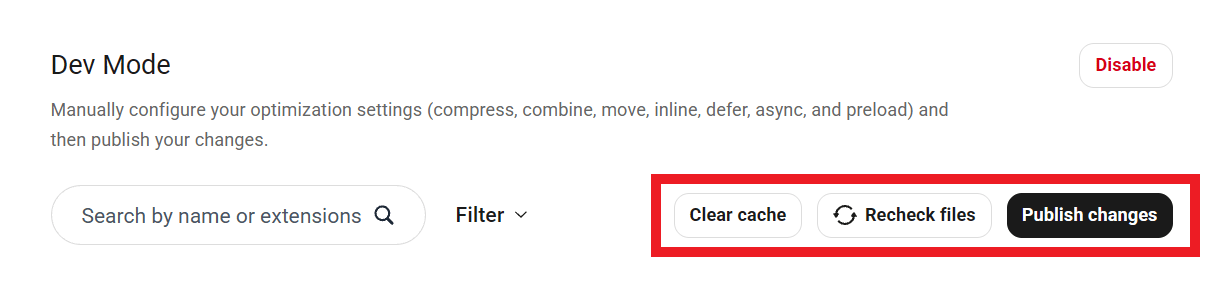
Click Clear cache to clear all local or hosted assets. Files will recompress the next time site pages are loaded. See also Clear cache shortcut in Settings > Others.
If you’ve added or removed plugins or themes, click Recheck files to update the file list and ensure the latest assets are included in optimization.
Click Publish changes once you’re done optimizing files.
You can switch back to Automatic mode at any time by clicking the Disable button at top-right.
Dev Mode Configurations
Before we get into the different optimization tools, there are a couple of important points to keep in mind when making changes to your files.
You may not be able to implement every recommendation you get from performance tests. Every site is different, and just because an optimization tweak works for Site A, it does not mean it will work for Site B. It is a good idea to consider every performance recommendation, but understand that not every change will improve your site.
Avoid making bulk changes to assets. Unless you are very familiar and comfortable with how bulk asset optimization works, we recommend that you only make small, incremental adjustments and test each change before moving on to the next one. This careful, step-by-step approach makes it easier to identify which adjustment caused an issue if something breaks. Although it may feel slower, in practice it is the fastest and most reliable way to fine-tune your asset optimization.
To safely preview and test the impact of your optimization changes before publishing them, use the Safe Mode feature. It lets you see how your configuration affects your site while visitors continue to see the live version.
Hummingbird’s Dev Mode offers several tools to optimize each file individually and improve page load times.
- Compress – Minify files by stripping unnecessary code
- Combine – Combining smaller files results in fewer files making fewer requests
- Move to Footer – Scripts that aren’t required to load a page can be placed in the footer, ensuring they will not impede the loading of other page assets
- Inline CSS – Places CSS within the HTML file, reducing the number of files the browser has to download
- Defer – Force files to suspend loading until everything else has loaded
- Async – Asynchronously load assets, executing them as soon as they’re ready
- Preload – Preload key assets, ensuring they’re ready as soon as they’re required
- Don’t load file – Prevents specified files from loading on all pages
Each file available to be optimized by Hummingbird will be listed in its own row, with the available tools at the far right.
Once a file has been optimized, you’ll see both the original filename and the name of the optimized file generated by Hummingbird. That makes it easier to locate any file in your site’s source code if needed. You can also click on any filename to pop it open in a new tab and inspect its contents.

Compress
Compression removes the clutter from CSS and Javascript files. Smaller files, in turn, help your site load faster, since your server doesn’t have to waste time reading unnecessary characters & spaces.

Combine
Whenever possible, Hummingbird can combine smaller files together to reduce the number of requests made when a page is loaded. Fewer requests mean less waiting, and faster page speeds!

The Asset Optimization engine is built in a way to respect WordPress dependencies for styles and scripts. That means that two or more files will be combined only when they have identical attributes, otherwise, they will be skipped. For example, if you choose to combine files 1, 2, 3 and 4, the Asset Optimization engine will first try to combine files 1 and 2 and if that fails (due to dependencies described above), it will then try to combine files 2 and 3 and so forth.
If your Asset Optimization page does not contain the Combine option, this means that the Combine option is disabled because your server has HTTP/2 activated. HTTP/2 automatically optimizes the delivery of assets for you
Move to Footer
When it comes to rendering blocking issues and WordPress, the best practice is to load as many scripts as possible in the footer of your site, so that slow-loading scripts won’t prevent vital parts of your site from loading quickly. For each and every file, you will be able to decide whether you want to move them to the footer or leave them in their original position.

Read our blog on how to Eliminate Render-Blocking Issues with Hummingbird for more information on common render-blocking issues and how to handle them.
Inline CSS
Enable this option to add the CSS from this file to a <style> tag in the head of your pages instead of loading the file.

Note that if a CSS file is larger than 4kb, the Inline option will be disabled for that file because large blocks of inlined CSS can break your page style.

If needed, you can override this limit by adding the following filter to your theme’s functions.php file or a mu-plugin.
add_filter( 'wphb_inline_limit_kb', 'adjust_inline_limits' );
function adjust_inline_limits( $value ) {
return 50.0; // Set any value in Kb.
}
Preload
Key assets can be preloaded, meaning they will start loading before rendering begins and will be ready as soon as they’re required. As such, preloaded files are less likely to block the page’s render, improving performance.

Don’t load file
If you click on this tool, it will prevent the file from loading.

Defer
For hosted JavaScript files, you will have the option to Defer (force load it after the page had loaded). This means they will load only after everything else on your page has loaded, which allows you to load the most important files and content first.

Async (asynchronously load)
For external JavaScript files, you will have the additional option to load assets asynchronously, executing them as soon as they’re ready. For unsupported browsers, Async will automatically fallback to Defer, loading the files after the page has fully loaded.

Optimize Font
This option only appears for Google fonts if they are being used on your site. It enables you to optimize font delivery so they don’t trigger the “Eliminate render-blocking resources” recommendation in your performance tests.

Asset Status
Each asset will have a status icon indicating its current state. For example, the possible states for the Compress option are:
- Gray icon – Marks the files that are already compressed (like *.min.js and *.min.css.).
- White icon – Indicates which files can be compressed.
- Green icon – New assets selected for compression.
- Can’t be compressed – This marks the files that can’t be compressed (usually it’s external resources).
Hover your mouse over any icon for additional information about its active/inactive status.

Bulk Update
If you have multiple files that need to have one or more actions applied to all of them, you can click the checkbox next to each file and then click on the Bulk Update button that will appear at the bottom of the screen.
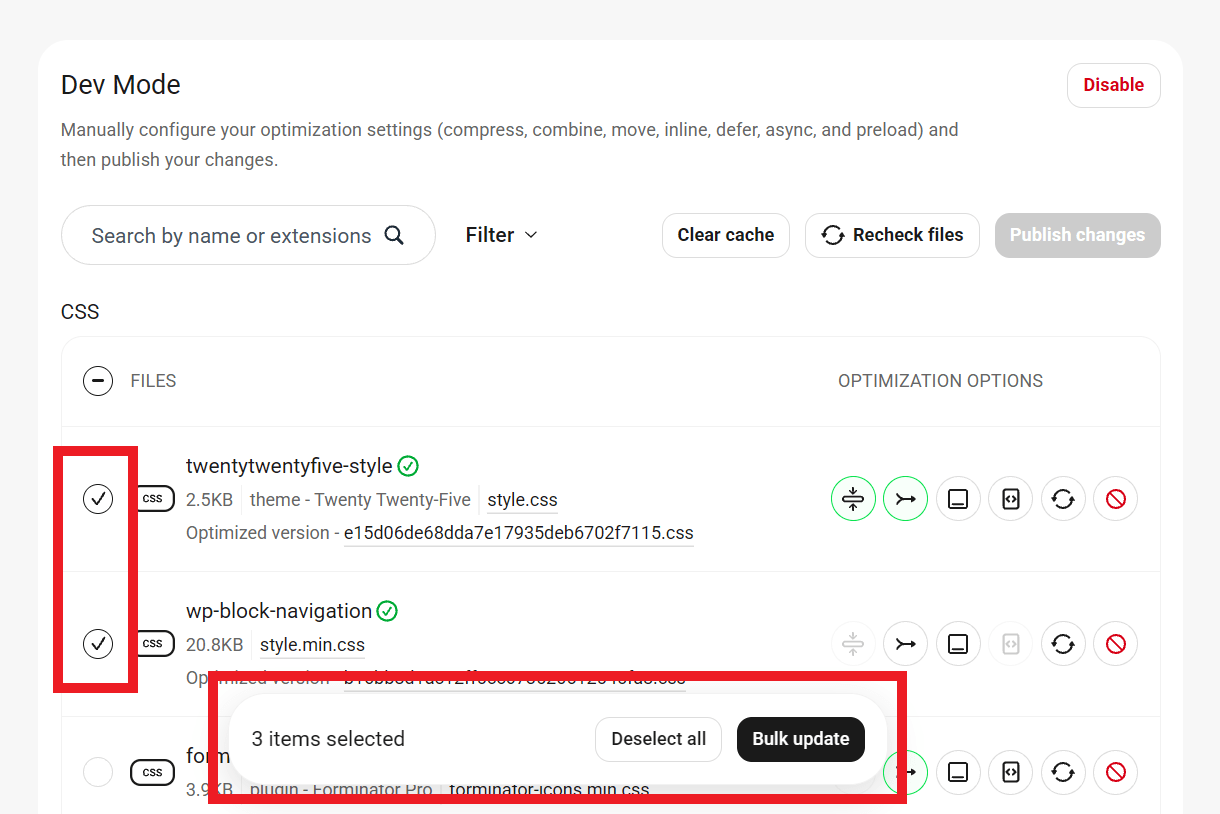
A modal will then pop up that will let you choose which options to apply to all of the selected files.
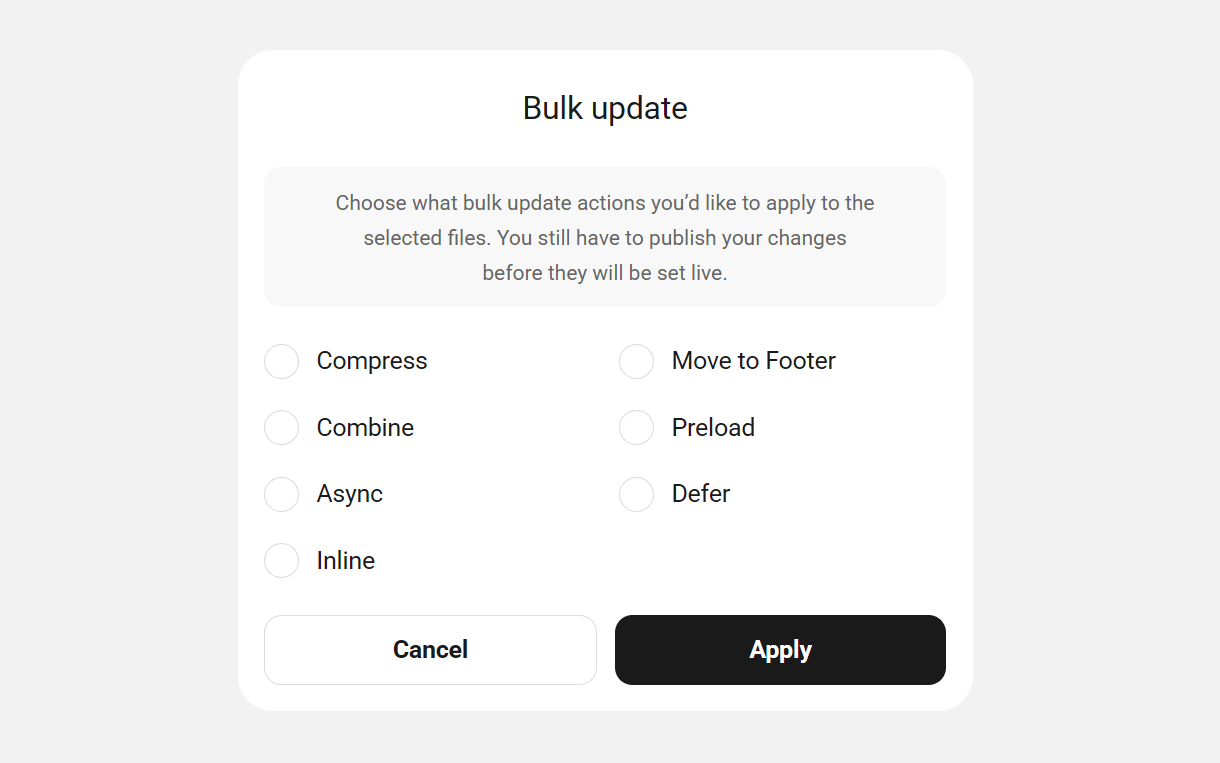
Note that you cannot Defer a CSS file or set Inline for JavaScript.
2.3.7 Dev Mode Optimization Tips
Link to chapter 3Successful asset optimization varies greatly from site-to-site, depending on the plugins and themes installed and activated.
In this section, we will look at steps for using Hummingbird’s Dev Mode for successfully compressing, combining, and moving your CSS and JS files without breaking the style or functionality of your website.
While you’re configuring things, you can use a handy little Hummingbird feature that allows you to temporarily disable Asset Optimization on the page you’re viewing to check if there are any unwanted layout issues.
In the toolbar on the frontend, click “See this page unminified” in the Hummingbird menu.

Clicking that will append this to the URL in the browser’s address bar to let you know Asset Optimization is disabled temporarily on the page:
?avoid-minify=true
To get the optimized page back, simply remove that from the URL and reload the page, or click to any other page on your site, then click back to one you’re viewing. Don’t use your browser’s “Back” button though, as you’ll just come back to the unminified page again.
When configuring Asset Optimization, remember to turn off or clear cache, including page, preload, browser, and server-side object cache.
1. Install and configure your plugins and theme – If you add or delete a plugin or theme it will change available assets. If you are not seeing assets from a specific plugin or theme, clear your cache and use the Recheck files button to reload available assets.
2. Use your theme’s file optimization tool first – Premium themes and page builders sometimes include an asset optimization feature that will resolve 80% of your issues. This should be configured before you setup Hummingbird Asset Optimization. Here are some examples of popular theme asset optimization features:
Avada is one of the most popular premium WordPress themes. Check out our blog on How to Speed Up and Optimize Avada for Free Using Our Smush and Hummingbird Plugins for more information on using these two world-class plugins for maximum performance.
Check out our blog on How To Utilize Page Builders Built-In Optimization Options to learn more about the first steps to take in making your site fly!
3. Run Hummingbird Asset Optimization – Now that your plugins and theme are activated and setup, use the Recheck files option to get an updated list of all assets. Then compress and combine everything using the Bulk Update feature.
4. Move files to the footer – Move all your files to load in the footer except the jquery, jquery-migrate, and core theme JavaScript files. Use the Plugin or Theme filter if you are unsure which files belong to your theme files.
Click the Publish changes button to push your changes live. This may break functionality or styling but stay calm and continue with testing.
5. Move files with an error to the header – Visit key pages on your site and use the browser console to check for errors. On any page of your site, right-click, select Inspect, and open the Console tab.

Return to the Hummingbird Dev Mode tab and move files flagged with an error to load in the header by unchecking the Move to footer option.
6. Defer scripts not needed immediately – Finally, use the Defer option available in the JavaScript section to defer scripts that you don’t need immediately (like a form script or a spam protection script).
If you run into any issues, you can quickly deactivate Dev Mode by clicking the Disable button at the top of the screen.
2.4 Cache
Copy chapter anchor to clipboardCaching is a fundamental part of enhancing site performance.
Hummingbird offers several types of caching that you can control from within the plugin.
2.4.1 Page Caching (Server)
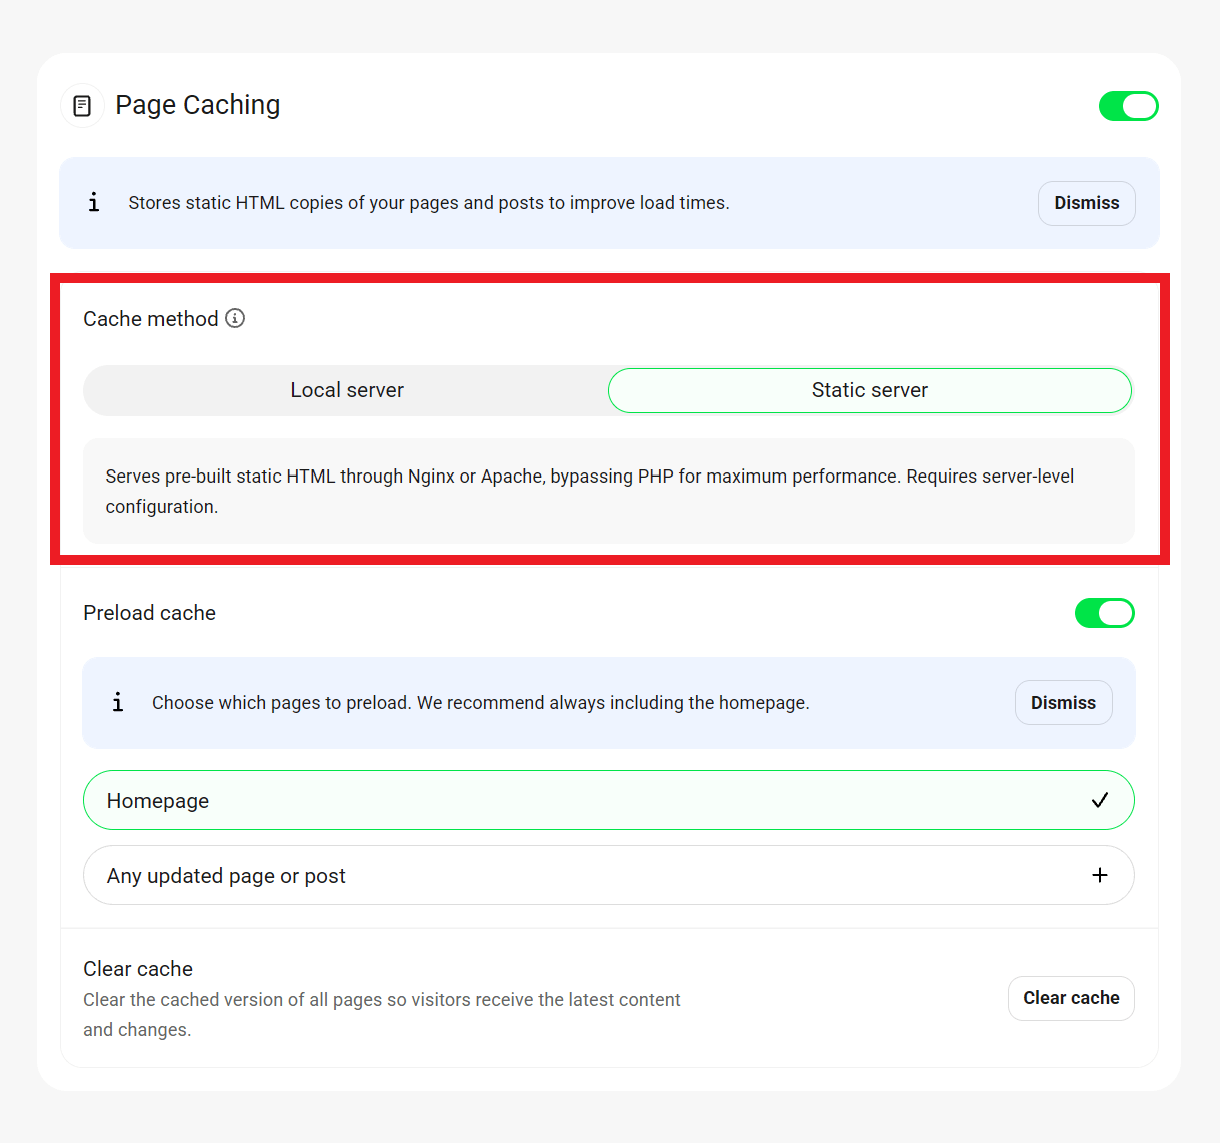
Link to chapter 4When hosting with WPMU DEV, Hummingbird’s Page Caching feature will default to using your server’s Static server cache if enabled. It can significantly speed up your site and allows an average of 10 times more concurrent visitors. See static server cache compatibility and what does it cache exactly? for more information.
To get started, toggle on the feature in Hummingbird > Cache > Page Caching.

Once activated, you can switch between Local server and Static server cache methods by clicking on the corresponding option.
Preload cache
Enable preload caching to create and preload the cached page and post files automatically. This is marginally faster than the default setting, which waits until someone visits your site to load cached pages.
Note that preload caching should have no adverse performance impact on the average site but it may have an impact on very large sites while it’s running. This can occur both on the frontend and in the admin and the database, while wphb_cache_preload is running in SQL.
Select which pages you want to include in the preload cache feature. We recommend that you always have the homepage checked if this is enabled.
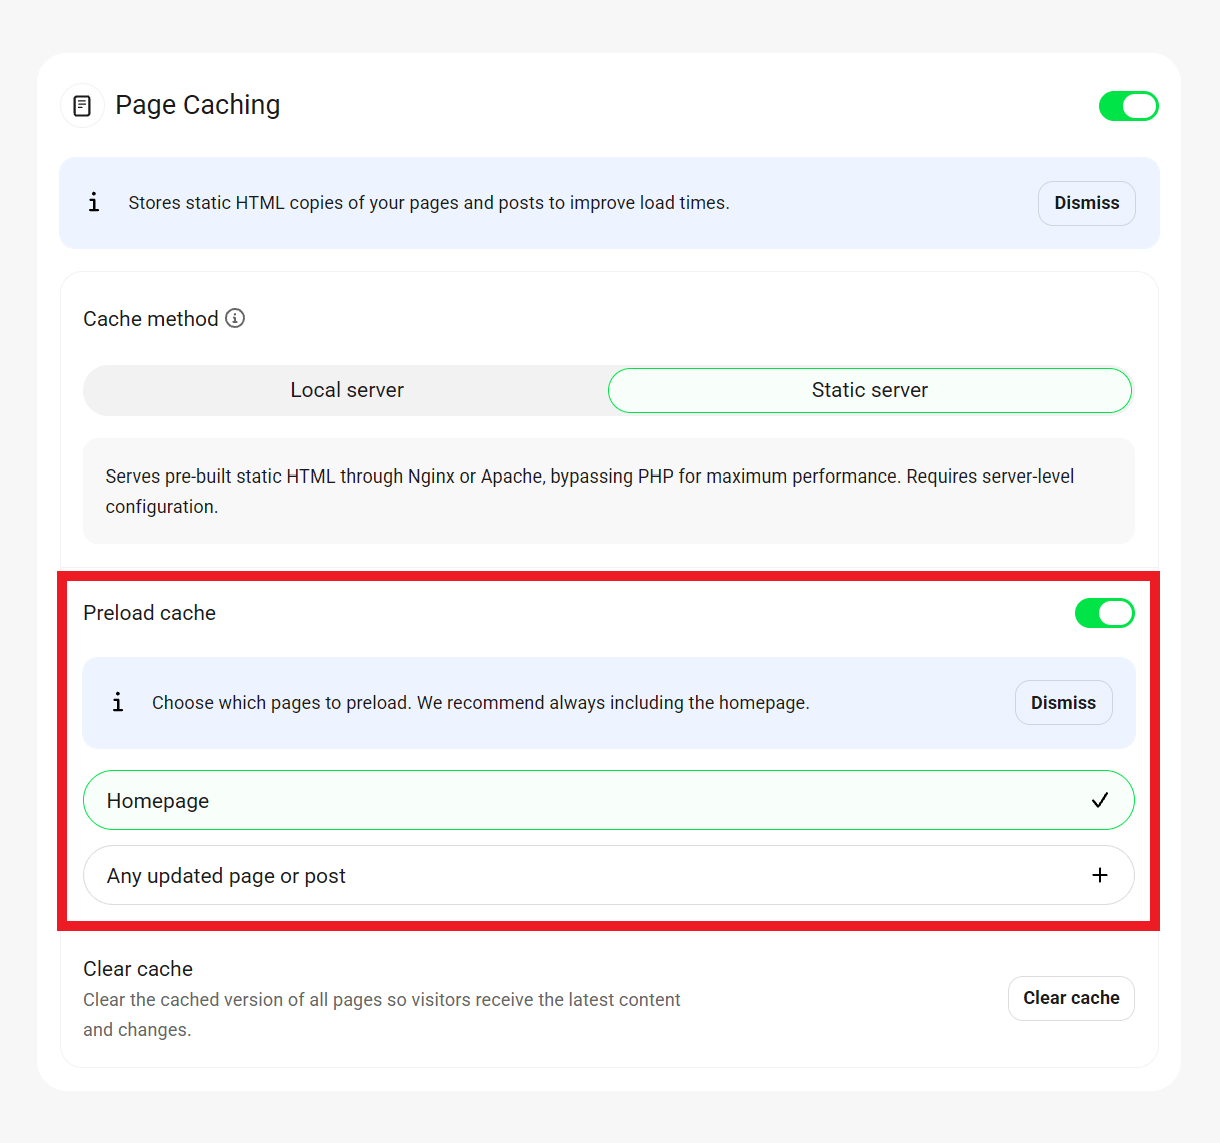
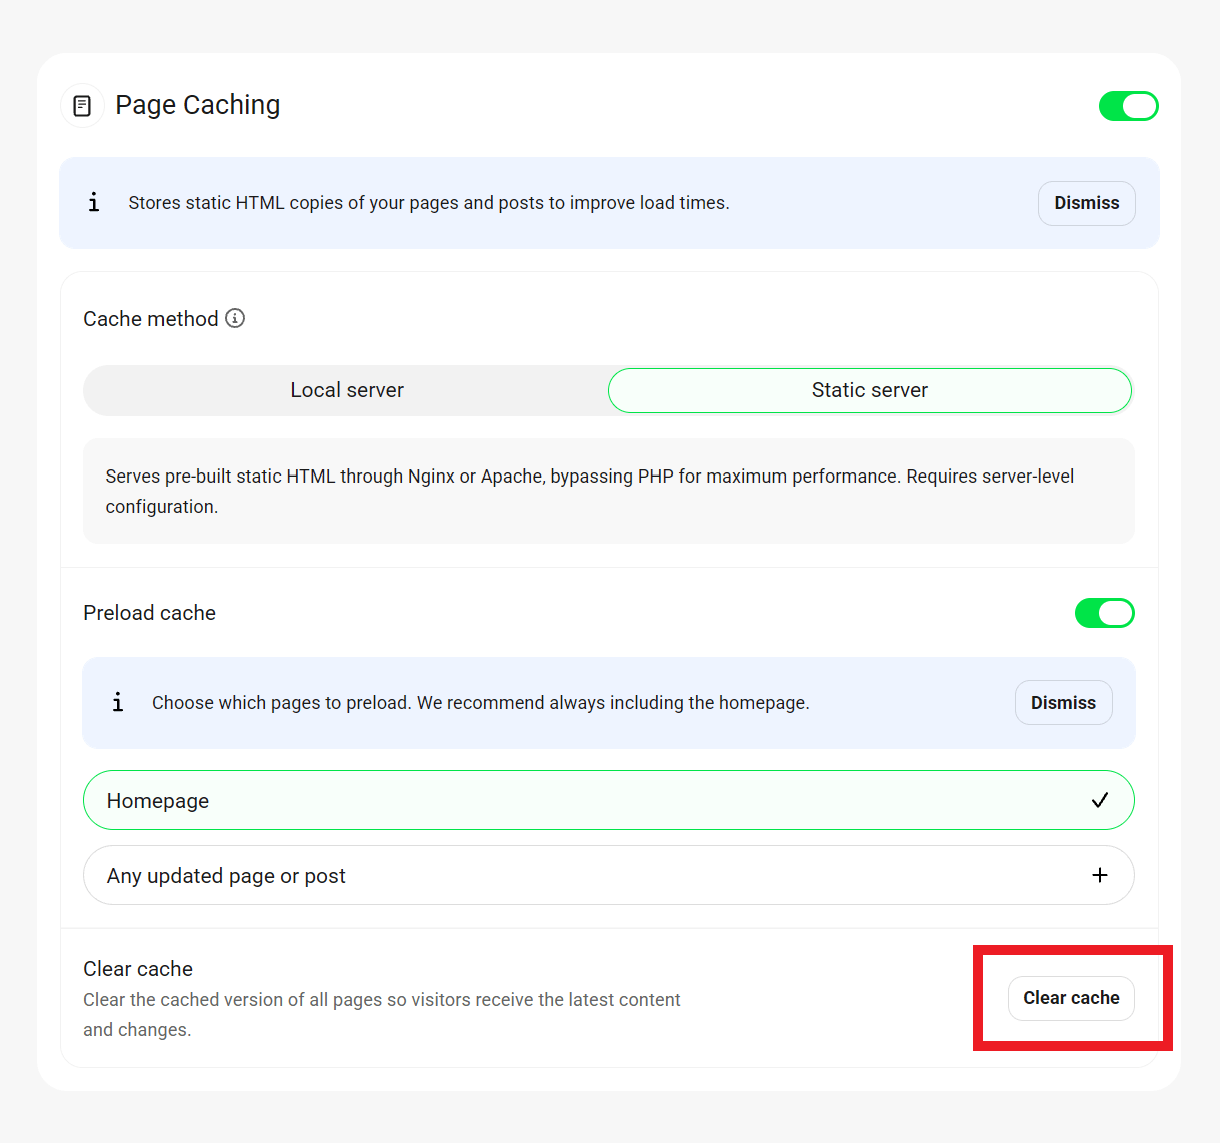
Clear cache
To clear the full page cache manually at any time, click the Clear Cache button at the bottom of the card.
Cache settings
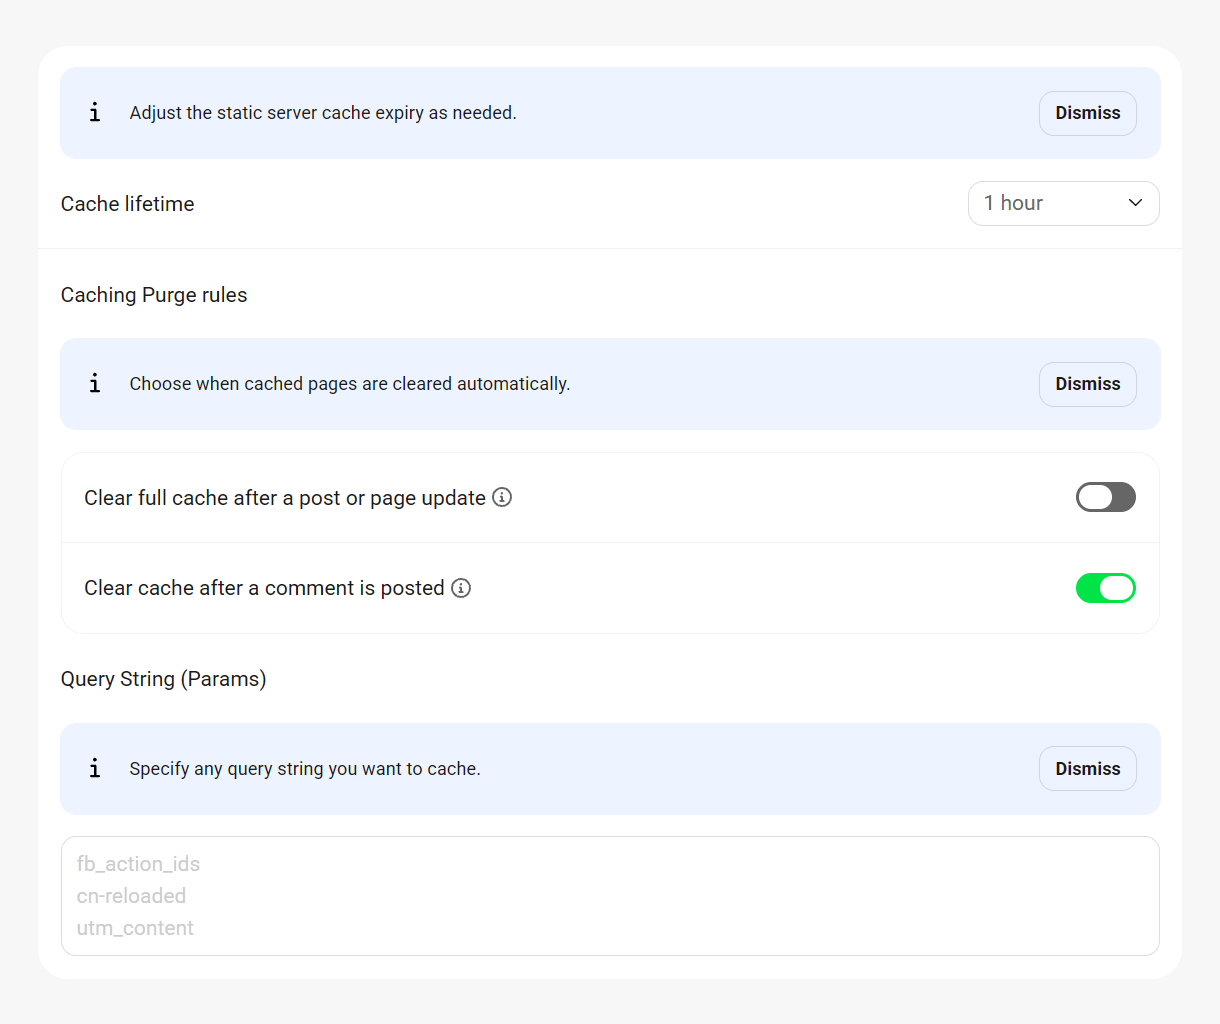
Cache Lifetime
This option lets you set the cache lifetime to the static server cache. From the drop-down select the duration for the validity of the static server cache. The cache will regenerate automatically each time it clears.
Clear full cache after a post or page update
Enable this option to clear all page cache any time a page or post is updated.
Clear cache after a comment is posted
Enable this option to clear all page cache whenever a comment is made on any post.
Query String (Params)
Enter any query strings (e.g., ref, utm_source, utm_medium, utm_campaign, etc), one per line, that you want to be cached.
Exclusions
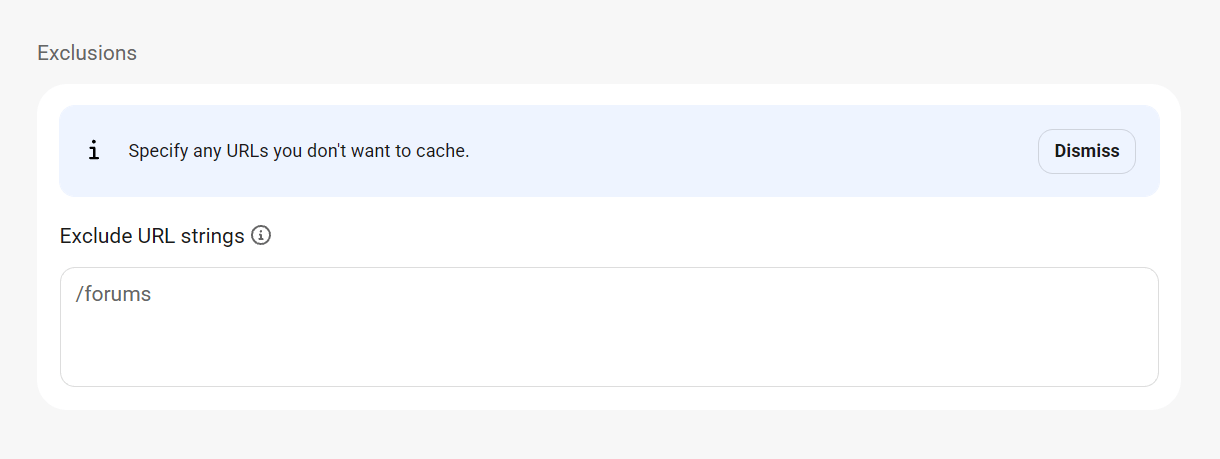
In this field, you can specify any URLs or URL strings that you want to exclude from caching. E.g., if you add /blog it will also exclude /blog/samplepost or parentpage/blog/ from the cache. See also Static server cache exclusions on a multisite network.
2.4.2 Page Caching (Local)
Link to chapter 4When hosting with a 3rd-party host, Hummingbird’s Page Caching feature will default to using Local page cache which creates and stores static HTML copies of your pages and posts. This requires fewer scripts and no database interaction to load. These static pages are served to visitors whenever possible, reducing server load and dramatically improving pagespeed.
To get started, toggle on the feature in Hummingbird > Cache > Page Caching.
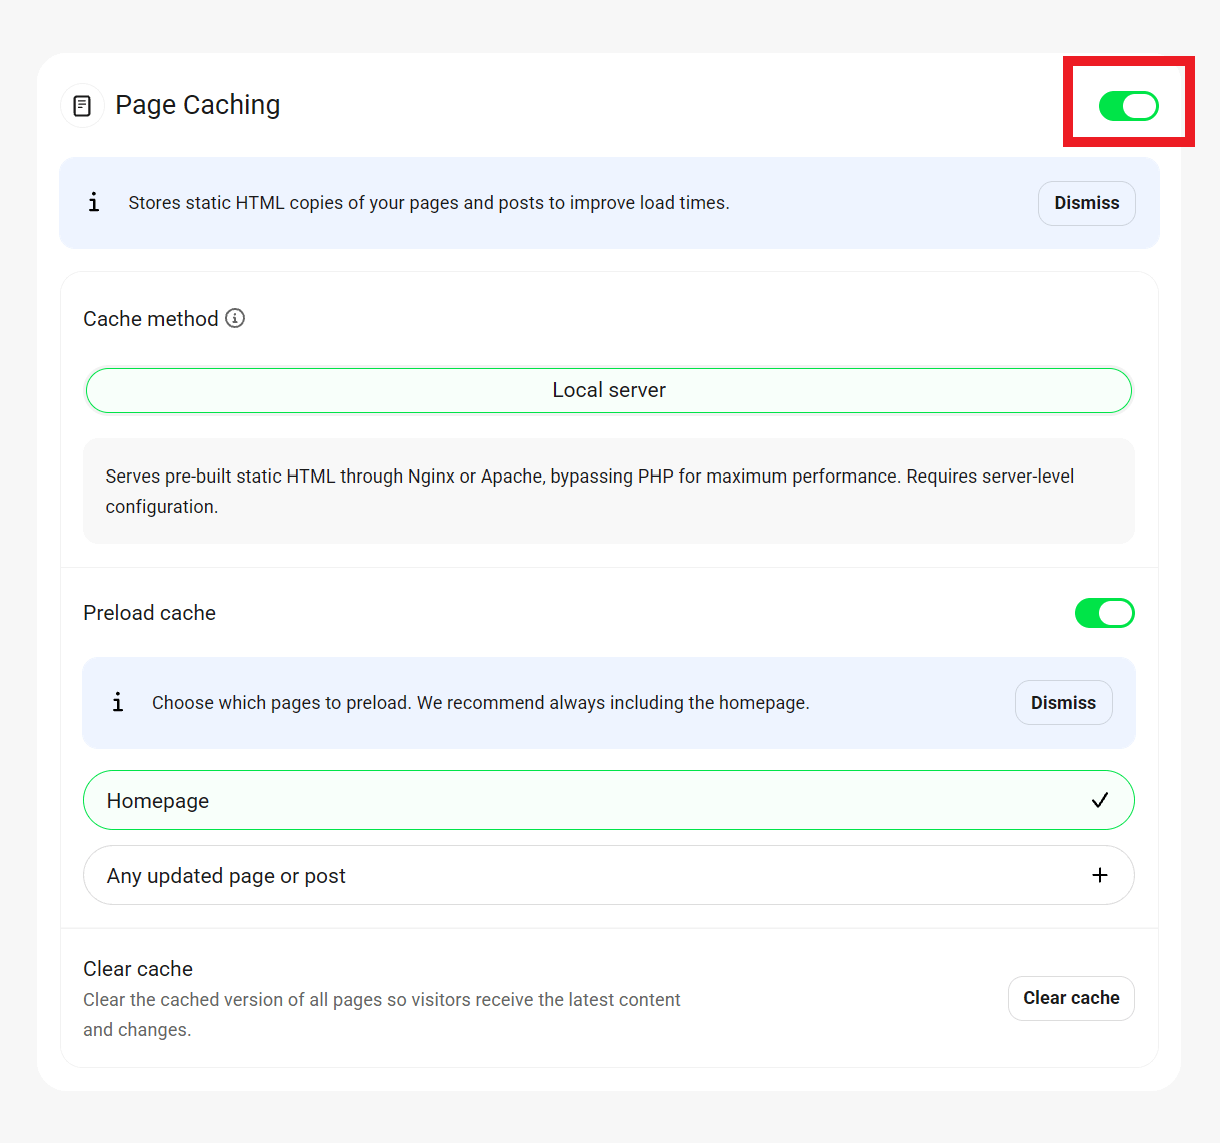
Note that if your site is hosted with WPMU DEV, you can switch between Local page cache and Static server cache by clicking on the corresponding option in the Cache method section. See static server cache compatibility and what does it cache exactly? for more information.
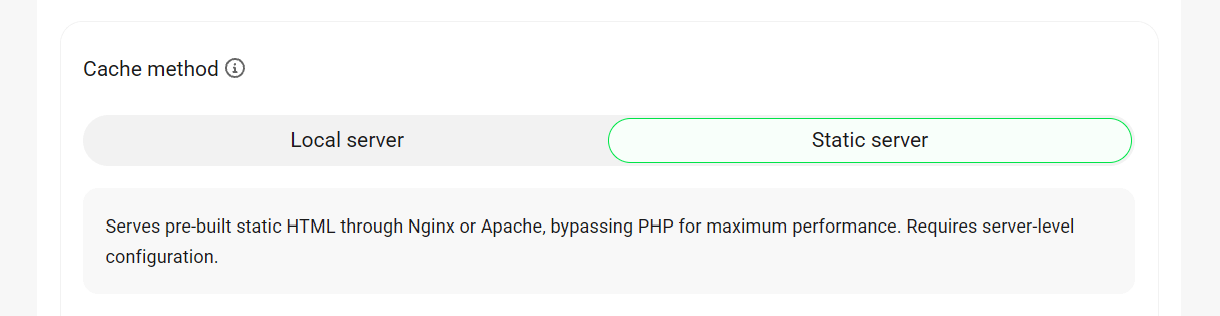
The Preload cache and Clear cache options are the same for the Local cache method as they are for the Static cache method above.
Cache coverage
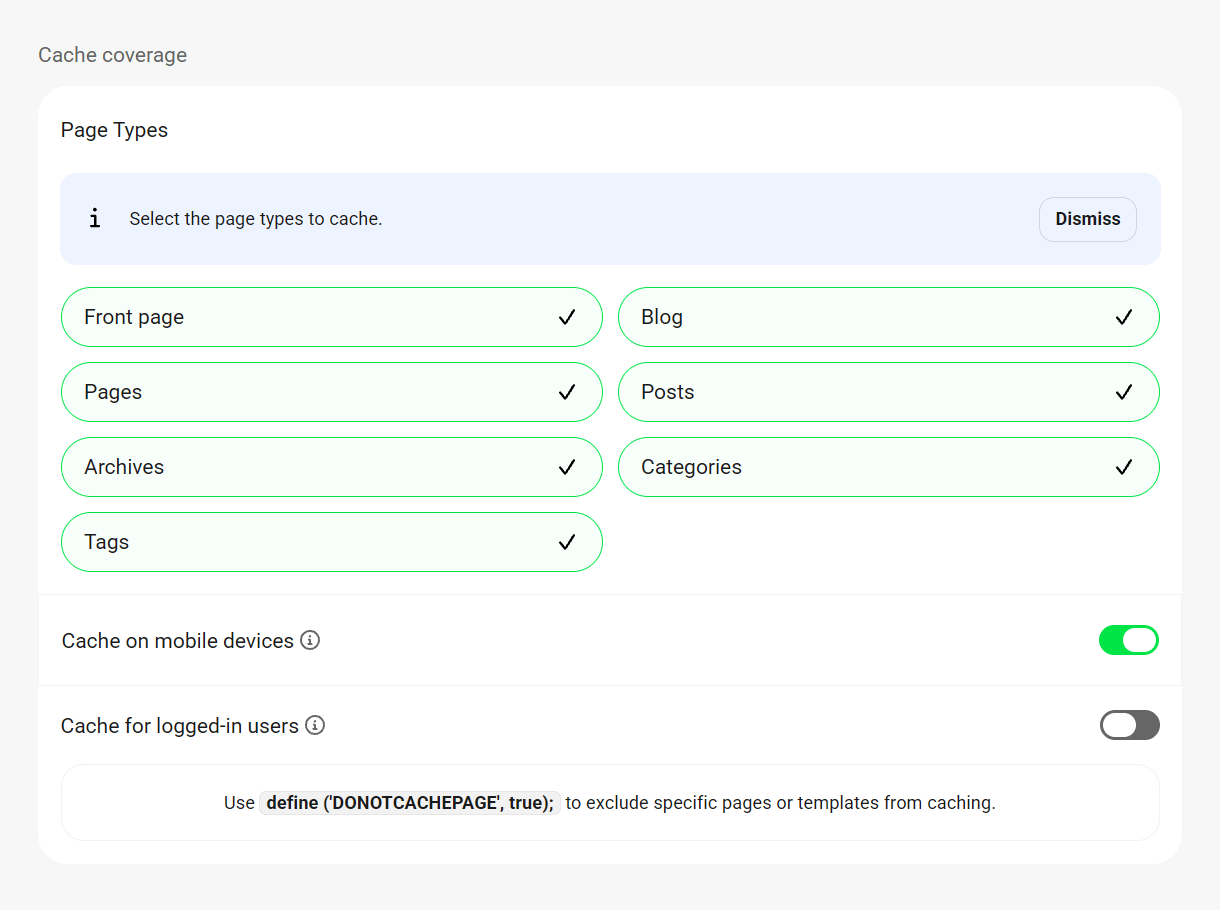
Page Types
Choose the pages you want to be served from cache. Only pages that update frequently should not be cached.
Cache on mobile devices
By default, page cache only affects desktop devices. Toggle on this option to enable page caching for mobiles devices as well, and help your users save their mobile bandwidth.
Cache for logged-in users
By default, logged-in users are not served cached pages, and therefore, are assured of seeing the most up-to-date content. However, if a site hosts a large number of logged-in users simultaneously, serving them cached pages can improve performance.
Caching page templates
Users developing their own themes can use the define('DONOTCACHEPAGE', true); constant to prevent their page template from being cached.
File Change Detection
By default, Hummingbird will automatically purge the page cache when it detects a change to your file structure, for example when a plugin or theme is activated or updated. But you can modify that behavior here if you wish.
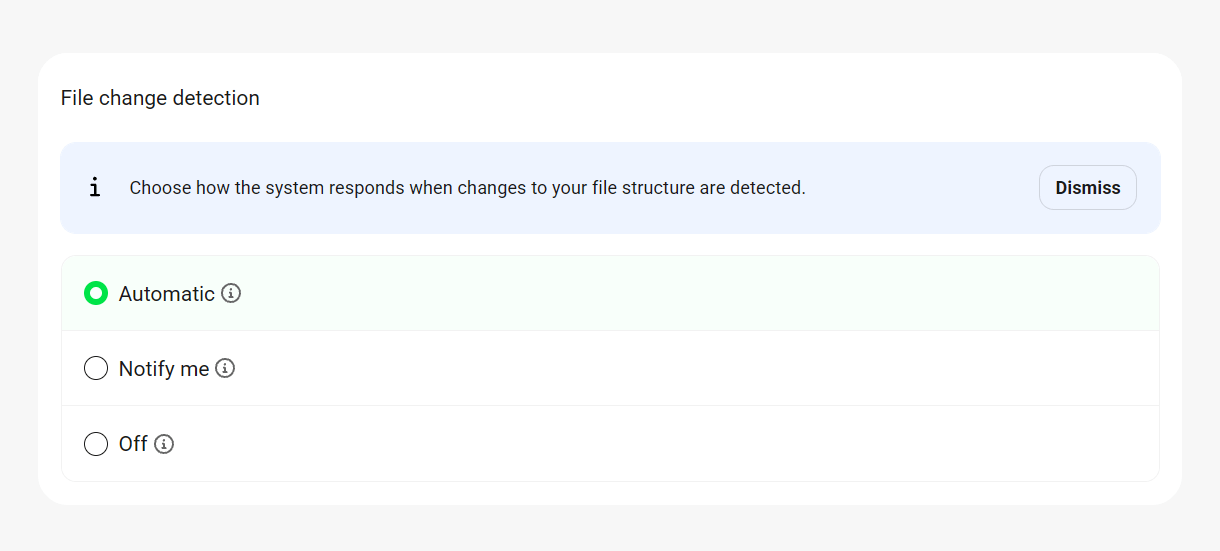
- Automatic – This is the default which will automatically clear page cache with any change to your site’s file structure.
- Notify me – Select this option to display a notice on every screen in your wp-admin prompting you to manually clear page cache if a change is detected.
- None – This option disables automatic cache purge if the file structure changes, and does not show any notices.
Caching rules – Advanced
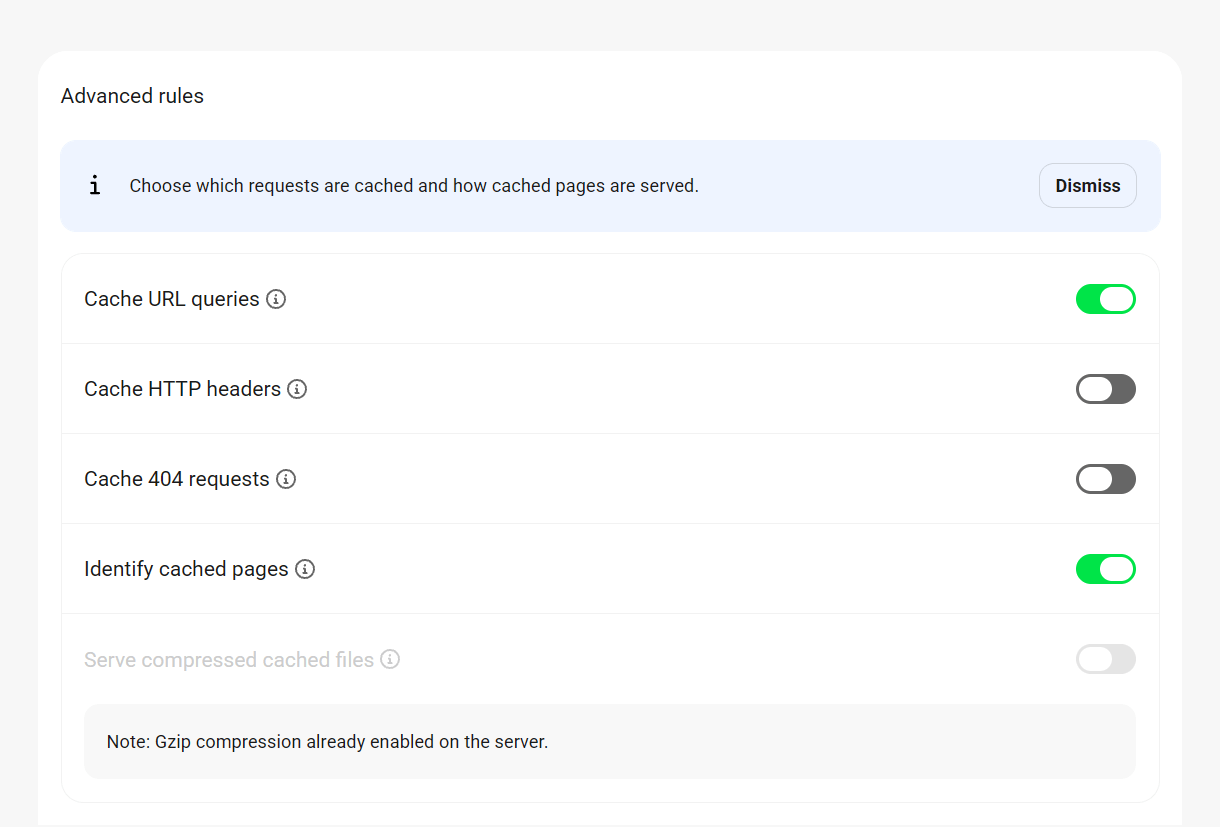
Cache URL queries
Pages with URLs containing query strings, as in http://example.com/?bar1=a&bar2=b, are not cached by default, because such pages are usually dynamic. Enable this option if you want them cached. Doing so may improve pagespeed.
Cache HTTP headers
By default, Hummingbird won’t cache HTTP headers. Enable this feature to include them and help resolve issues if security headers are not detected on cached pages.
Cache 404 requests
404 pages are typically not cached due to the issue that it can cause for search engines. Enable this option to cache 404 pages.
Identify cached pages
Enable this option and Hummingbird will insert a comment into the head tag of all cached pages, making it easy to determine if a page is being served from a cached file. An additional comment will be inserted at the bottom of the page source showing the timestamp of when the cached file was created.
Note that some servers may strip out comments in source code, but you can always check for this response header in your browser’s developer tools in any case:
hummingbird-cache: Served
Serve compressed cached files
Enabling this option will improve performance on servers where gzip compression isn’t already in place. If gzip compression is already enabled on the server, this option will be greyed out.
Caching rules – Purge
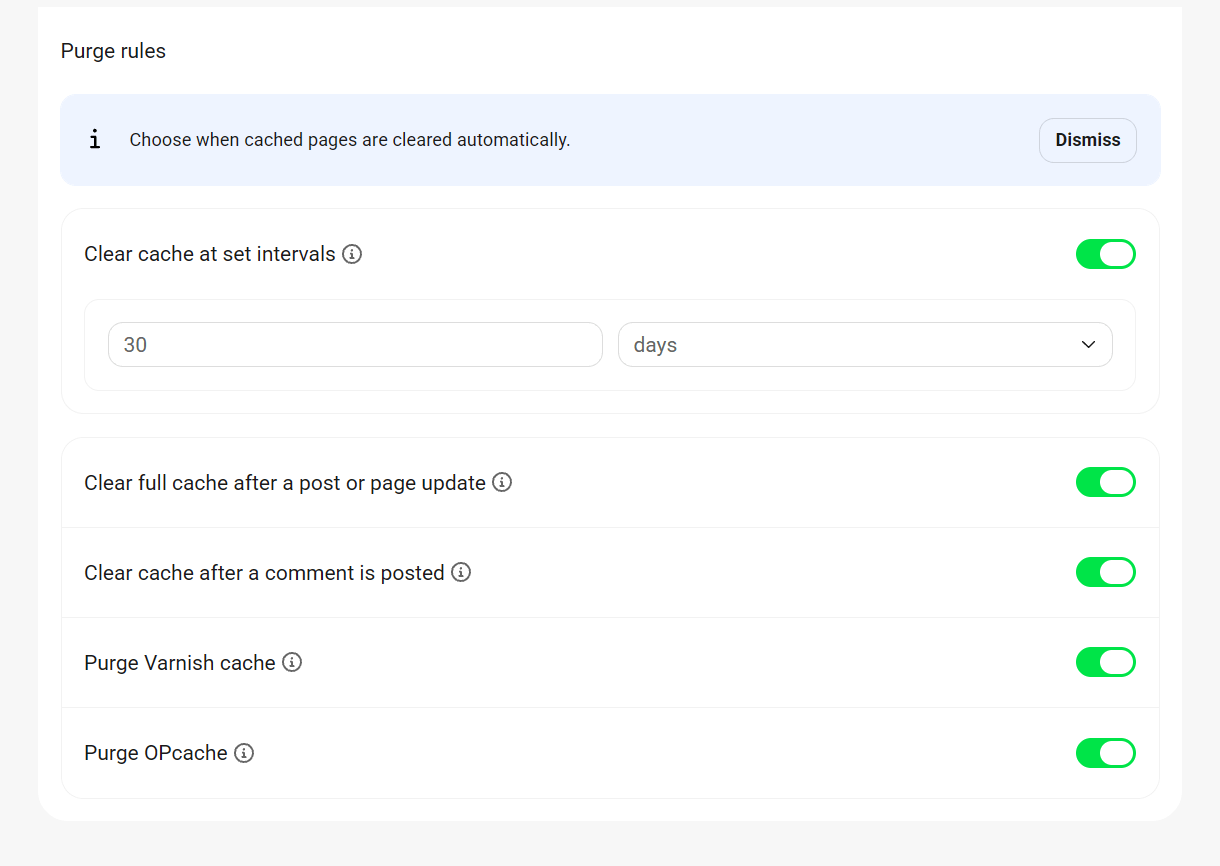
The Clear full cache after a post or page update and Clear cache after a comment is posted options are the same for the Local cache method as they are for the Static cache method above.
Clear cache at set intervals
Set the maximum period of time you want to pass before Hummingbird refreshes your site’s page cache. Overly frequent cache clearing – more than once a day – can cause server issues.
We recommend setting this time relative to the frequency that content is updated. There is no reason, for example, to refresh cache every 24 hours for a site that is only updated once a week.
The interval you set here will check against the “last modified time” of the wphb-cache.php file located in your wp-content/wphb-cache directory.
If the amount of time you set here is greater than the time elapsed since that file’s last modified time, page cache will be cleared and regenerated for a page the next time it is visited.
Note that the wphb-cache.php file’s last modified time updates whenever you save Page Caching settings, so that effectively “resets” the clock for this feature.
Purge Varnish cache
Enable this option to automatically purge Varnish cache on your server, if enabled, whenever you publish posts, pages or comments.
Purge OpCache
Enable this option to clear OpCache, if enabled, when you click the Clear Cache button in the admin bar.
Exclusions
Exclude URL strings
This option enables you to specify exact URL strings that should not be cached. URLs must be added one per line using absolute or relative URLs, and you can use regular expression syntax. Hummingbird has already added the following URL strings for you by default:
wp-.*\.php
index\.php
xmlrpc\.php
sitemap[^\/.]*\.xml
Exclude user agent
This is used for preventing caching based on the user agent so the relevant search engines are always provided with live data. User agents must be added one per line. Hummingbird has already added the following user agents for you by default:
bot
is_archive
slurp
crawl
spider
Yandex
Exclude cookies
Exclude specific cookies by entering their IDs in this field, one per line. Hummingbird has already added the following cookies for you by default:
wp_woocommerce_session_
wpdef_lockout_
If you are running WooCommerce on your site and don’t see the wp_woocommerce_session_ cookie in the Exclusions field, be sure to add it so your /store, /cart, /my-account, /checkout, & /addons pages are not cached.
Where cache files are stored
Hummingbird stores static HTML copies of your pages & posts in the following directory:
wp-content/wphb-cache/cache/[your-site-name]/[path-to-page]...
Cached versions for mobile users are stored in:
wp-content/wphb-cache/cache/mobile/[your-site-name]/[path-to-page]...
Each page & post is stored in its own folder, and each has a unique hashed filename, like:
133664efc1b97e0836b643de948afaf0.html
Customizing the hashed filename
Hummingbird can create and serve separate cached files for your pages according to whether a cookie is set or not, and what its value is set to. This can be very useful for marketing campaigns where you want page cache enabled, but need different versions of a page to be served to different users depending on the cookie.
To do that, you need only create a cookie with this at the beginning of its name (the rest of its name can be anything you like):
wphb_cache_
Once done, a separate cache file will be created for any page that has that cookie/value combination, in addition to the standard cache file for a page without the cookie.
For example, you could set a campaign cookie like this on your site, set to trigger for whatever conditions you need, and you would find a separate cache file for any page where the cookie has been set by your site visitors:
If you have another campaign cookie set up, that too would create a cached version of the page and be served to any other visitor for whom that particular cookie is set.
The image below illustrates an example of what you might see in your File Manager for a page where cached versions have been created for the default page, as well as a couple for various cookies set.

2.4.3 Browser Caching
Link to chapter 4Browser caching stores temporary data on your visitors’ devices so that they won’t download assets twice if they don’t have to. This results in a much faster second time around page load speed. Enabling caching will set the recommended expiry times for your content.
If your site is hosted with us, Browser Caching has already been configured and no further action is needed.
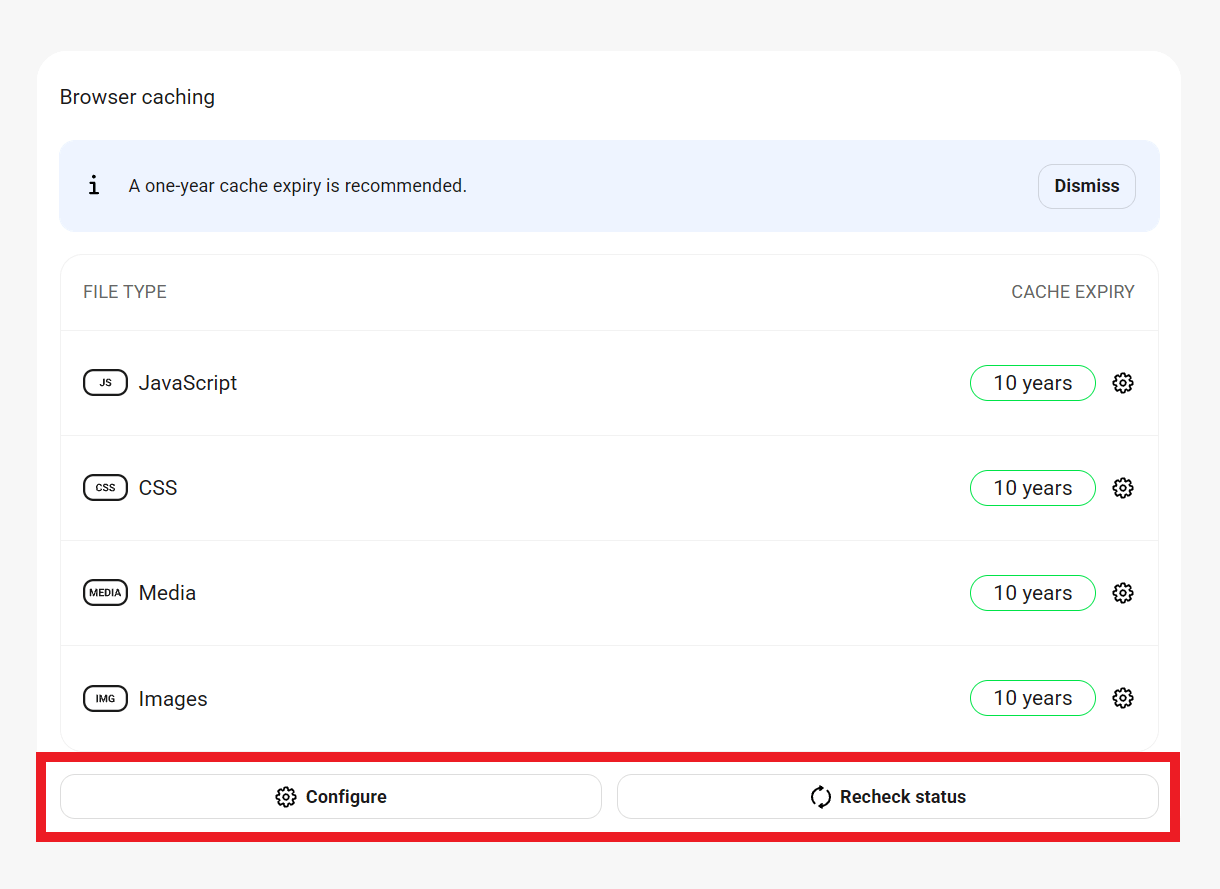
We automatically set the Expiry Time to the max (10 years) to ensure your cached content always loads in your visitors’ browsers and provides the fastest loading time possible for your pages. Don’t worry about that duration either as browsers always check for if-modified-since and last-modified expiry headers and will load the most recently updated content if it changes during that time.
To get started, access the feature in Hummingbird > Cache > Others.
The Browser caching card displays the current expiry time of all filetypes: Javascript, CSS, Media & Images. Click the Configure button or the gear icon on any file type’s row to open the setup wizard. Click the Recheck status button to ensure the status displayed is up-to-date.
Configuration
Hummingbird will automatically detect the Server Type used for your site. If the detected type is incorrect, click on the correct server type to change the selection.
Note that if you have enabled CloudFlare integration, whatever you have set as the Browser Cache TTL in your Cloudflare account will override your server configuration here.
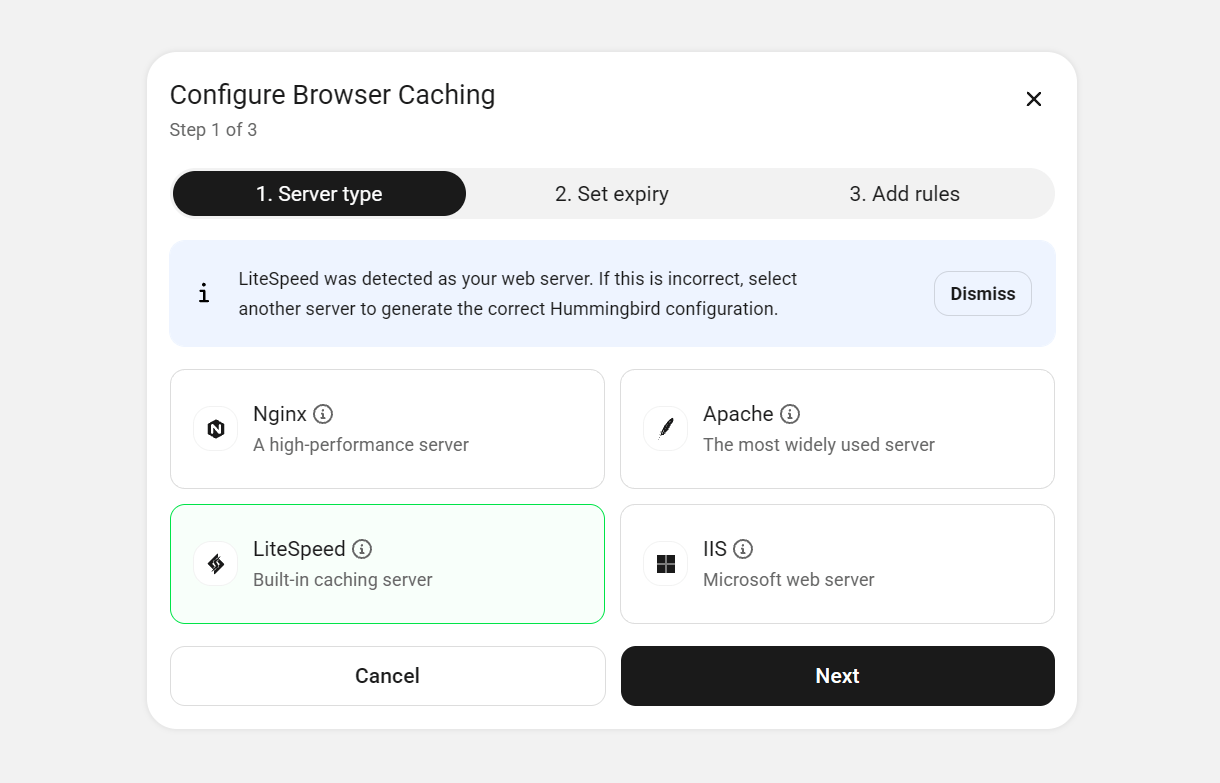
Click the Next button to proceed to the next step in the setup where you can select to set the Expiry Time for All file types or Individual file types. Ideally, this should be set to the longest value possible; Google recommends 1 year as a good benchmark.
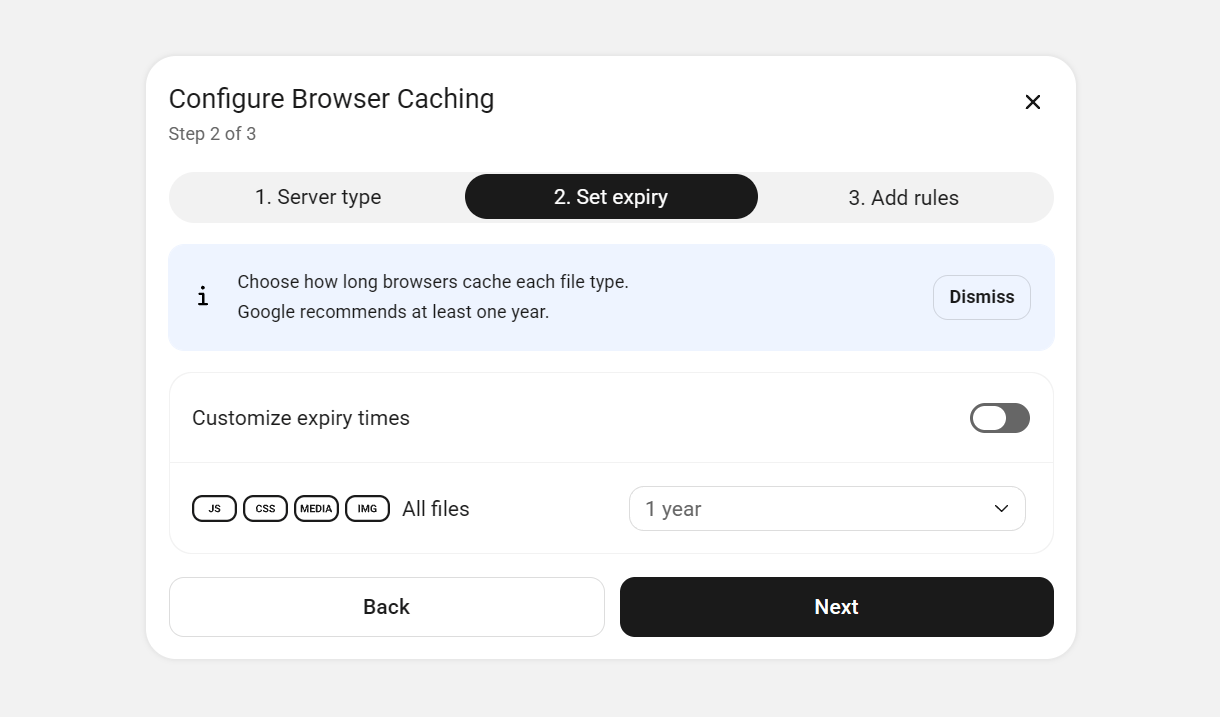
Click the Next button to proceed to the next step in the setup: Adding Rules for your server type.
Nginx
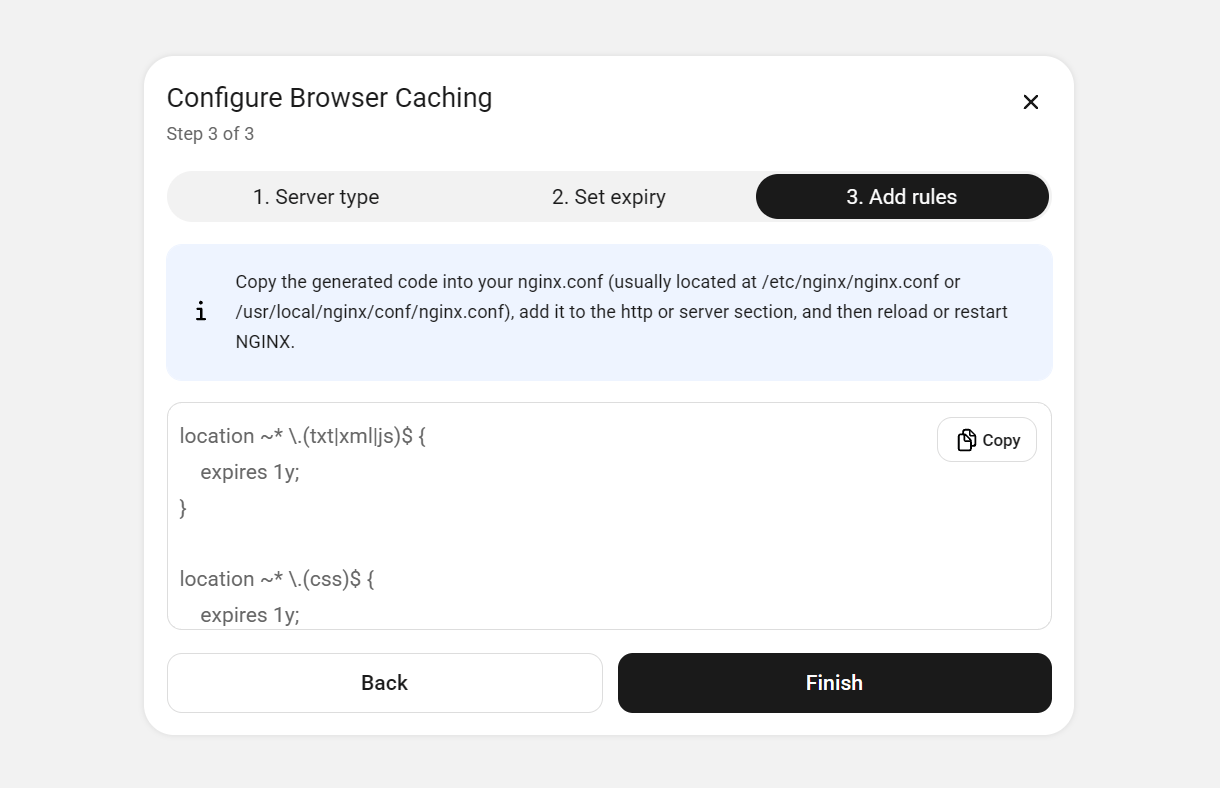
If your server type is Nginx, Hummingbird cannot configure browser cache for you automatically. You will need to manually add the required rules to your nginx.conf file, which is usually located at either /etc/nginx/nginx.conf or /usr/local/nginx/nginx.conf
Copy the rules generated by the wizard and paste them in your nginx.conf file manually. Then click the Check Status button.
OpenLitespeed/LiteSpeed
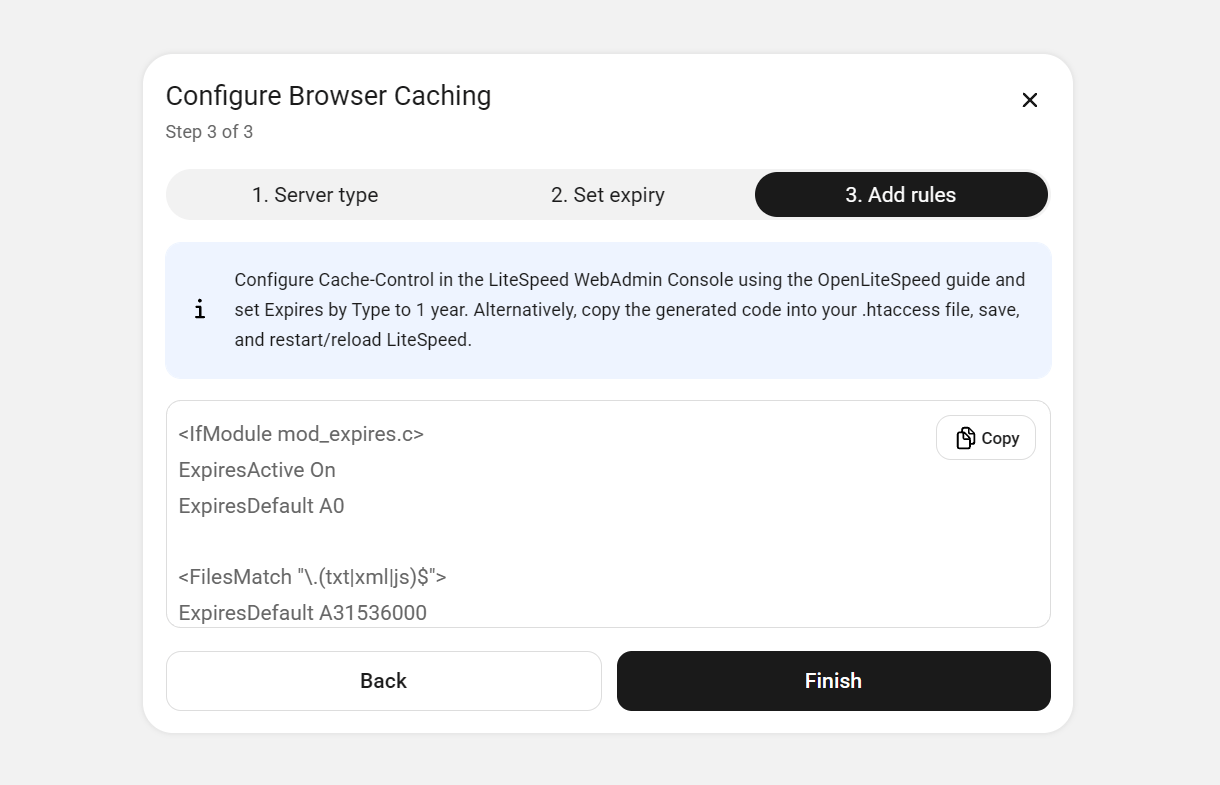
If your site is running on an OpenLitespeed server, Hummingbird cannot configure browser cache for you automatically. You will need to manually configure the Cache-Control header for browser caching in your WebAdmin Console following their guide here.
Alternatively, you can configure OpenLitespeed browser caching in your .htaccess file. Follow the directions shown in the setup wizard, then click the Check Status button. See this OpenLiteSpeed guide to learn more about automatically loading directives from the .htaccess file.
If your site is running on a LiteSpeed Web Server, you can copy the rules given here and paste them directly in your .htaccess file.
Apache
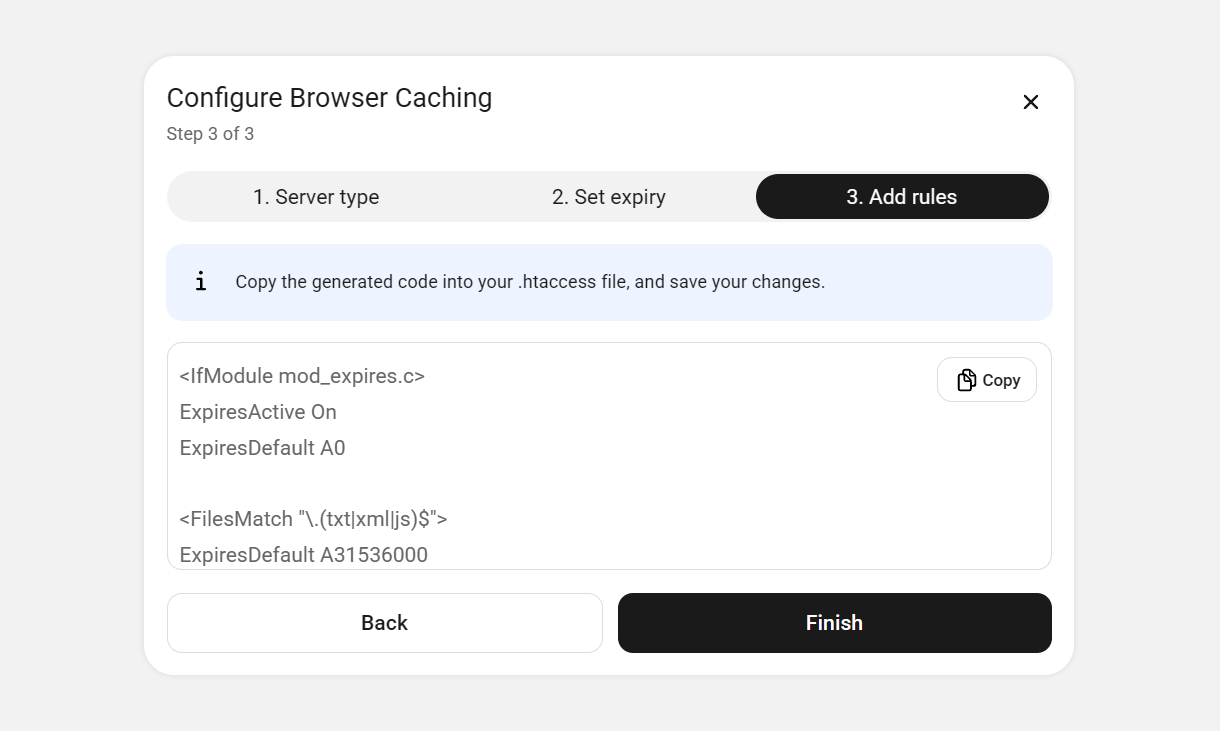
The wizard will attempt to apply the browser caching rules automatically to the .htaccess file on Apache servers.
However, if your .htaccess file is not writable or if the wizard encounters unexpected issues, you’ll be prompted to copy the code generated by the wizard, paste it in your .htaccess file & save your changes. Then click the Check Status button.
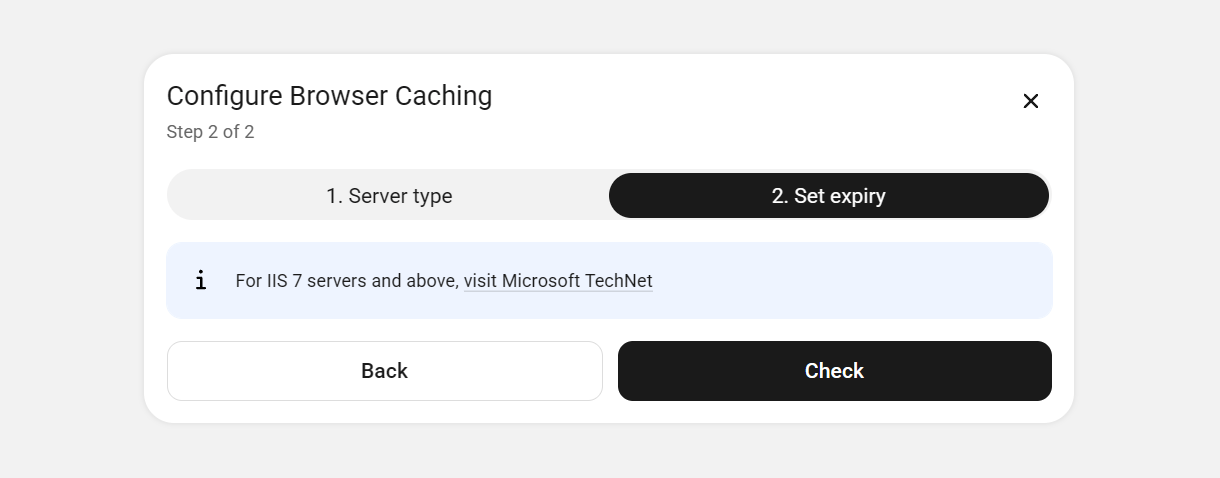
IIS
If your server type is IIS7 or above, you will be prompted to add the needed rules manually following the Microsoft guide here. Once done, click the Check Status button.
Don’t sweat it if this seems a little out of your depth. Contact support and our experts will help you out. :)
2.4.4 Gravatar Caching
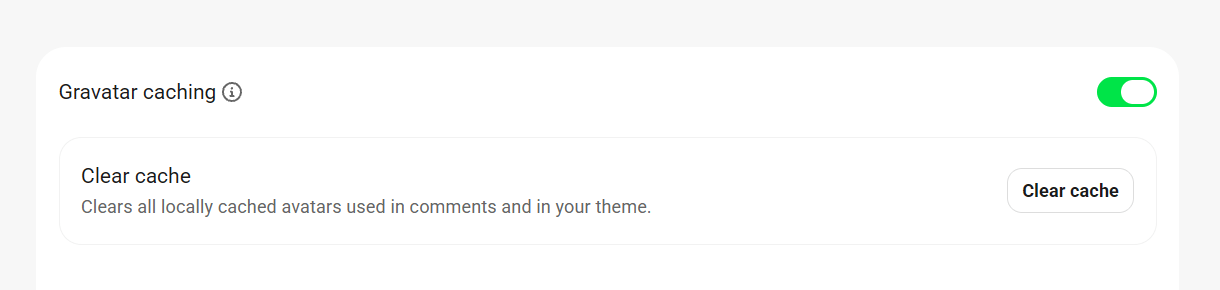
Link to chapter 4Gravatar caching allows you to store local copies of avatars used in comments and in your theme.
Simply toggle on the feature in Hummingbird > Cache > Others. See also Clear cache shortcut in Settings > Others.
2.4.5 RSS Caching
Link to chapter 4RSS Caching is handled by WordPress itself and activated by default. But Hummingbird gives you control over it.
To enable it, toggle on the feature in Hummingbird > Cache > Others. To disable RSS caching on your site, toggle the feature off.
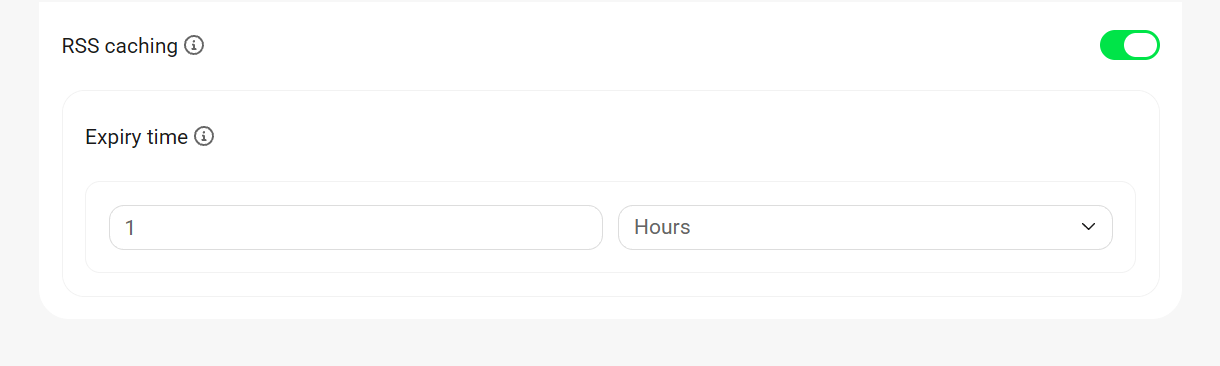
Expiry time – Set the duration in seconds, hours or days, and your RSS cache will be cleared at that time.
2.4.6 Cloudflare integration
Link to chapter 4Cloudflare is a Content Delivery Network (CDN) that sends traffic through its global network to automatically optimize the delivery of your site so your visitors can browse your site at top speeds. With their Automatic Platform Optimization (APO) feature, Cloudflare can also cache dynamic content and third-party scripts so the entire site is served from cache.
To get started, click the Connect button in Hummingbird > Cache > Others.
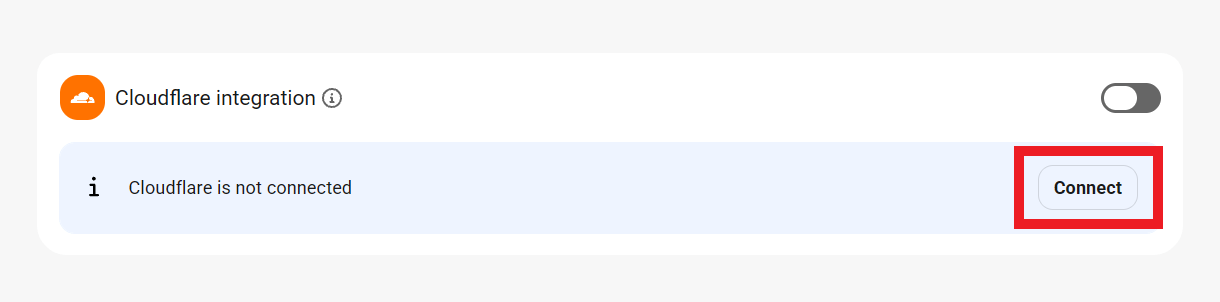
You can connect to Cloudflare using either your Cloudflare account’s email address and Global API key, or using an API token. Click either Global API Key or API Token and enter your API credentials.
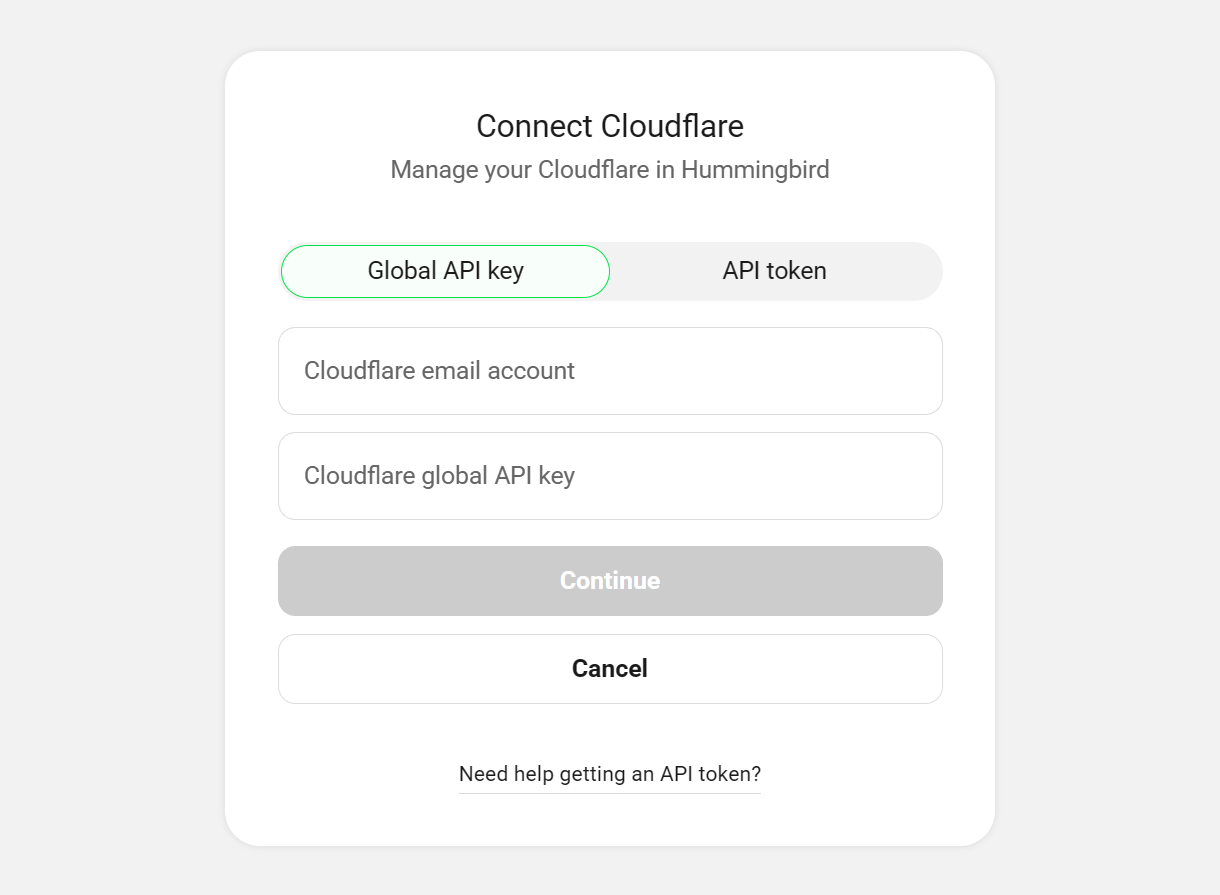
If you’re unsure how to get your Cloudflare API credentials, click Need help getting an API token? and follow the instructions accordingly, or follow the steps below.
To get your Cloudflare credentials, first log in to your Cloudflare account. Then, go to My Profile, and switch to the API Tokens tab.
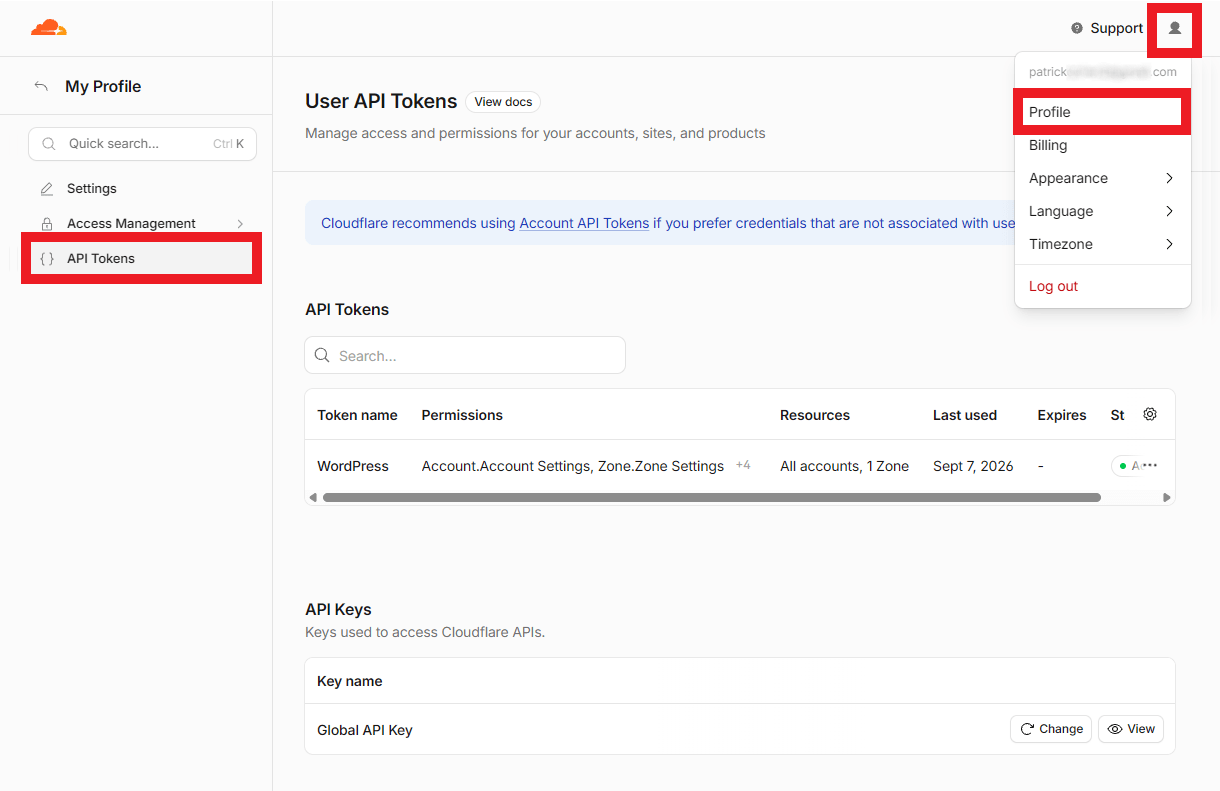
To get your Global API key, find the Global API Key row, and click View. Enter your password when prompted. Copy the API key and enter it into the Cloudflare Global API key field in Hummingbird.

Alternatively, to create an API token, navigate to the API Tokens tab and click Create Token.
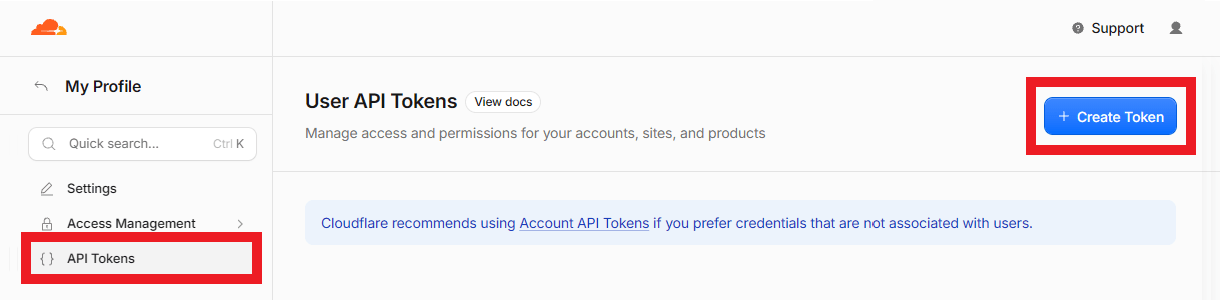
Then, find the WordPress row and click Use Template.

Under Zone Resources, first select Specific Zone from the dropdown menu and then select your website’s domain name.
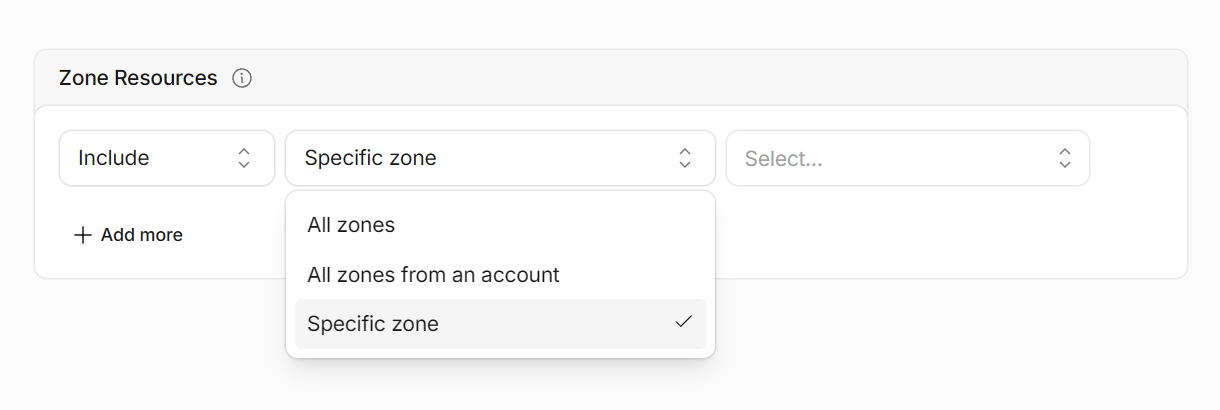
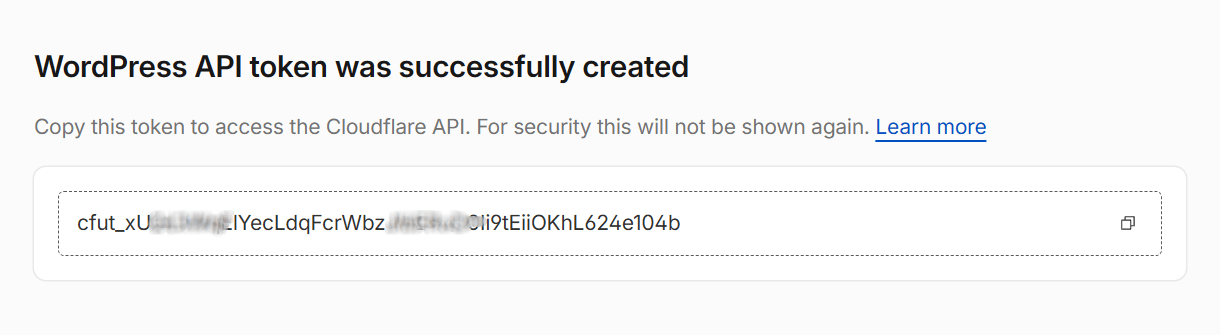
Click Continue to summary, and then click Create Token. Finally, copy the WordPress API token and enter it into the Cloudflare API token field in Hummingbird.
Once connected, Cloudflare will automatically configure your Browser Caching settings which you can adjust if needed in the Browser Cache card by clicking the Configure link.
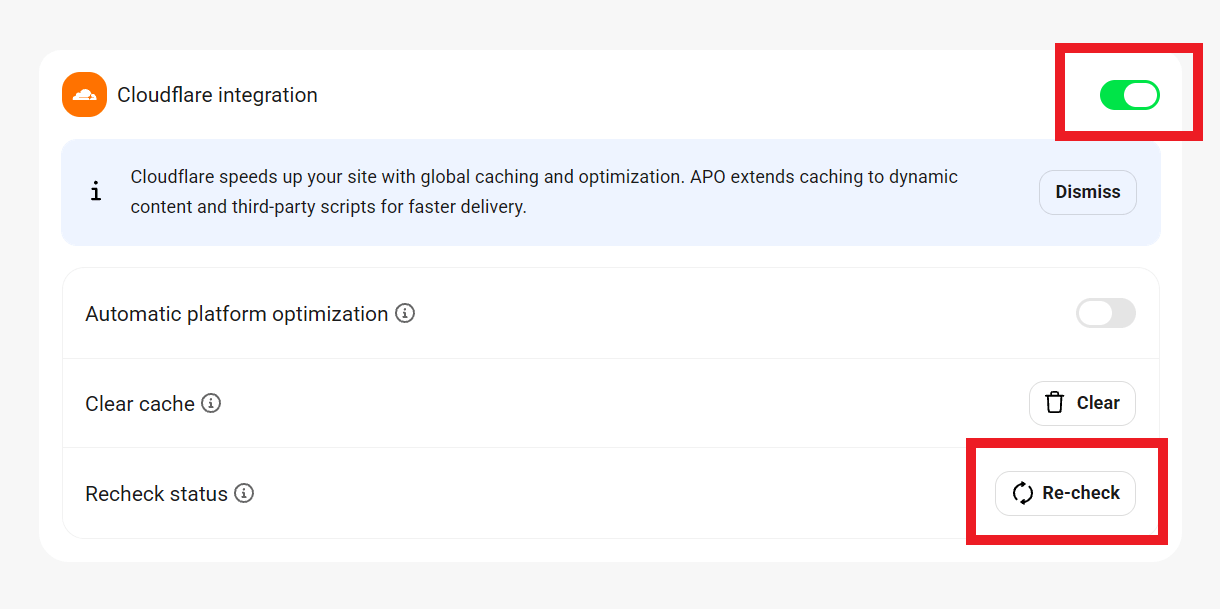
Click the Recheck button at any time to ensure that data displayed is up to date. Click the active toggle to disconnect the Cloudflare integration from your site if needed (this will also deactivate Cloudflare browser caching).
Automatic Platform Optimization (APO)
Cloudflare’s APO service is an additional cache feature that will serve all site content, including 3rd-party scripts, from their network, ensuring that your site is blazing fast.
Cloudflare’s powerful Automatic Platform Optimization (APO) feature is now available in Hummingbird! Check out our blog post on Hummingbird’s Cloudflare APO Integration to learn how this feature can benefit you and your clients.
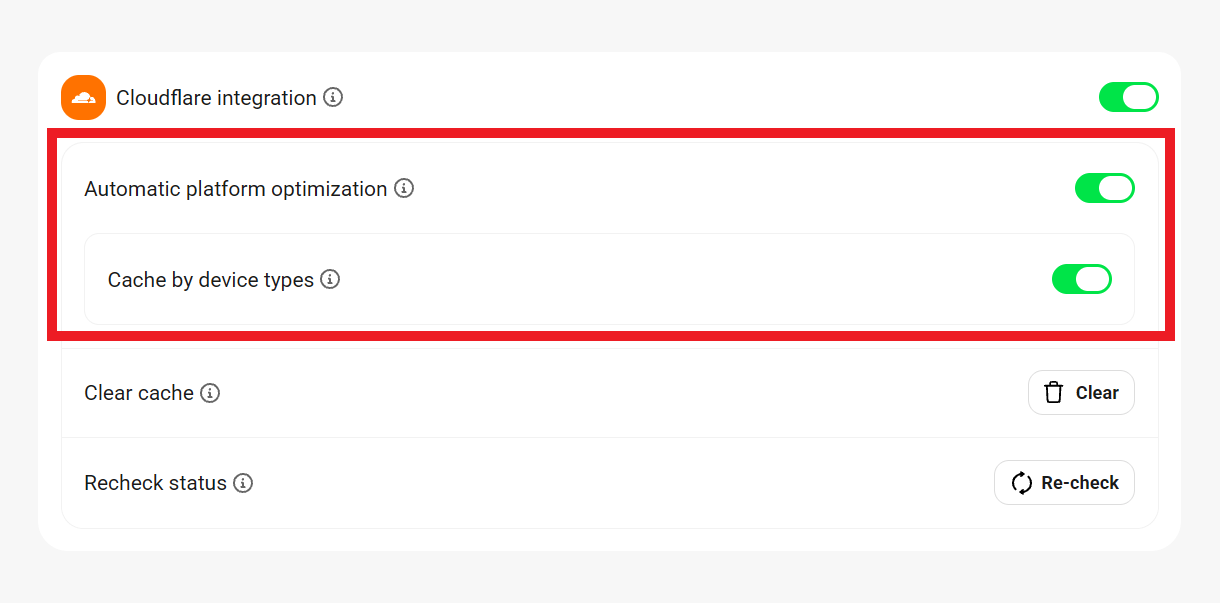
Enable the service by toggling on the Automatic platform optimization option here if desired (no additional plugin is needed). Note that this service is included with Cloudflare’s Professional, Business, and Enterprise plans, but requires payment if you are on their free plan. Details on their blog here.
Once enabled, you can also enable an additional option inside to cache content according to the device types used by your site visitors. Cache by device type ensures that only needed assets are cached and delivered to the user’s browser depending on the device type used: mobile, tablet or desktop.
2.5 CDN Pro
Copy chapter anchor to clipboardBy default, your optimized files are hosted on your own server. When this feature is enabled, we will host your files on WPMU DEV’s CDN.
Go to Hummingbird > Settings > CDN and click the toggle to enable.
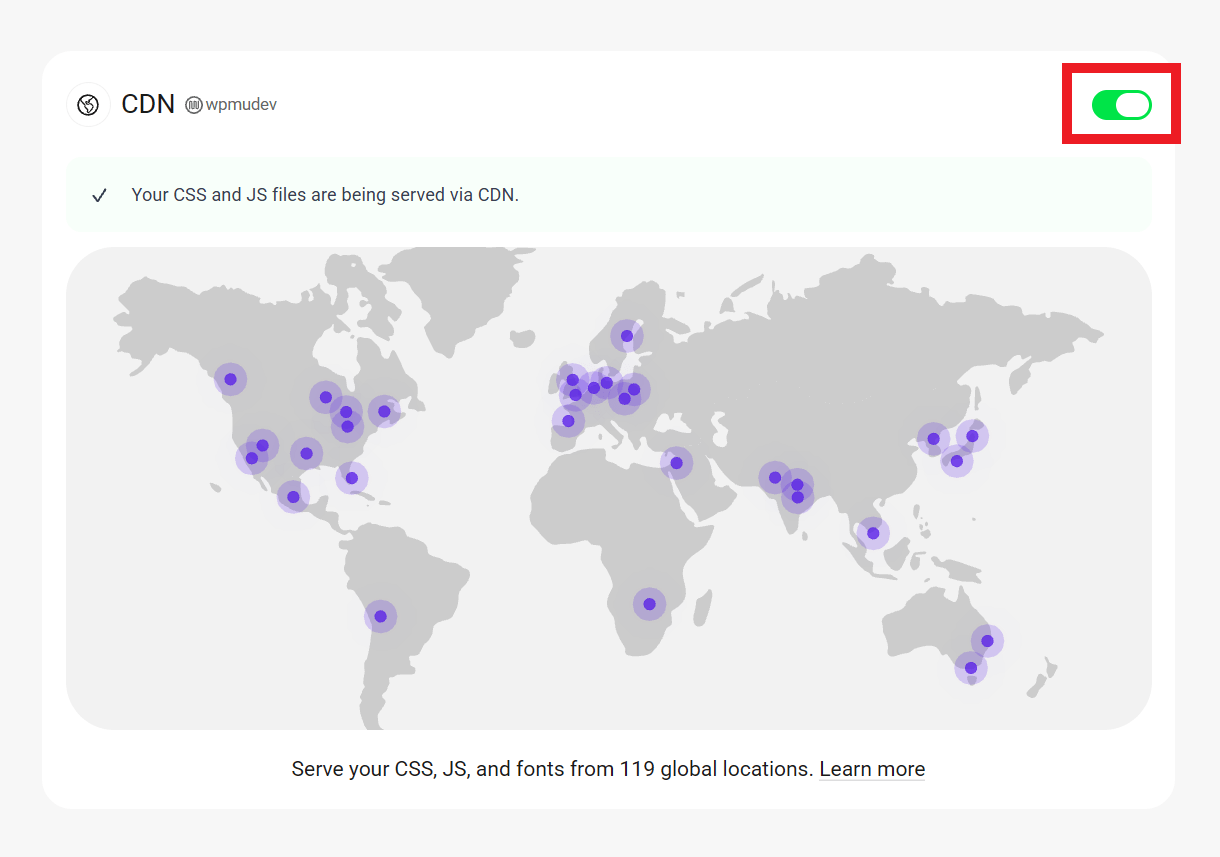
You can exclude any files from being served from the CDN by adding them to the Exclusions section. Hummingbird may automatically exclude files from using the CDN if they might break scripts and styles. Also, some externally hosted files can cause issues when trying to serve them from the CDN.
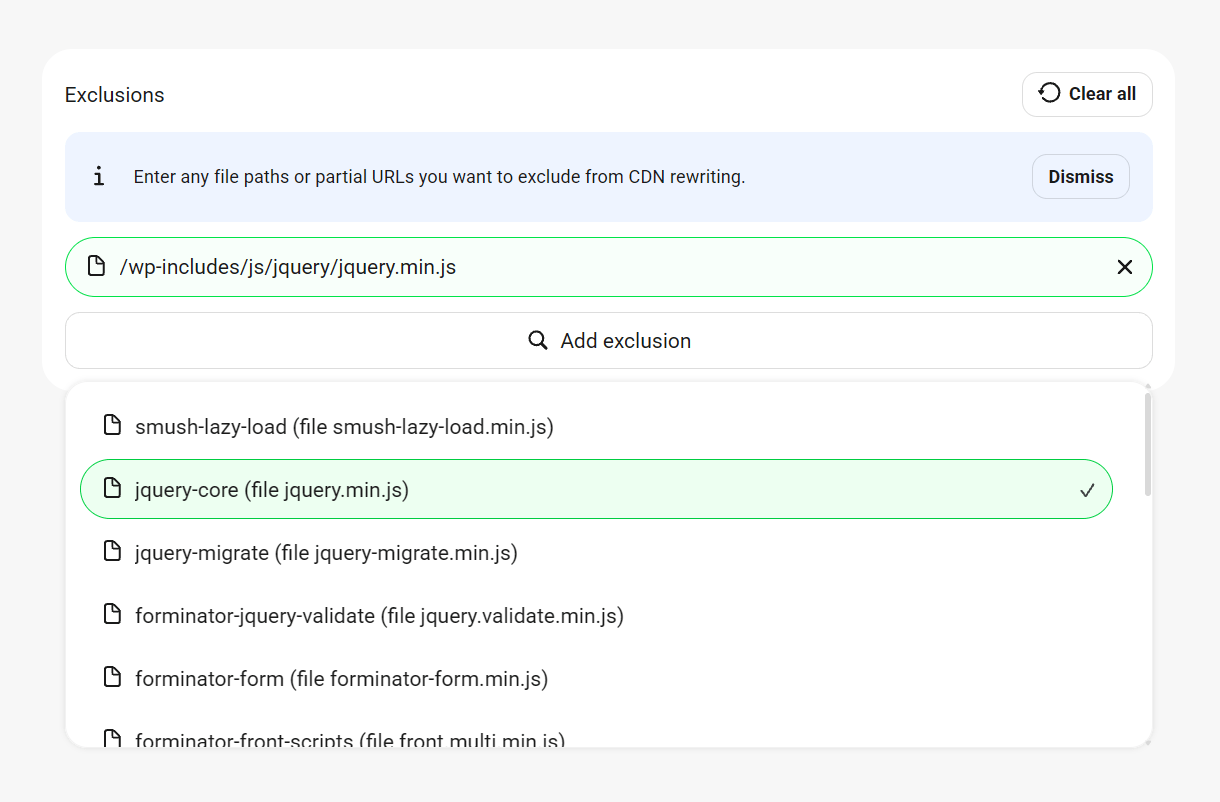
Note that the Hummingbird CDN only serves CSS and JS files. To serve image assets from our CDN (jpg, png, gif, webp only; SVG is not supported), you’ll want to use the CDN option in Smush Pro.
2.6 Advanced
Copy chapter anchor to clipboardThe Advanced Tools tab allows you to further configure Hummingbird to meet your specific site requirements.
2.6.1 Uptime
Link to chapter 6This feature enables you to be immediately alerted if your website goes down, and when your website has come back up. You can track how long your site was down for, when the last time your site went down, as well as your server response times.
To get started, toggle on the feature in Hummingbird > Advanced > Uptime.
Note that if the Proactive Monitoring service is enabled on your site, it is recommended to not deactivate the Uptime Monitor.
In Multisite networks, Uptime only reports data for the main site because subsites are always on the same server and share the same uptime data.
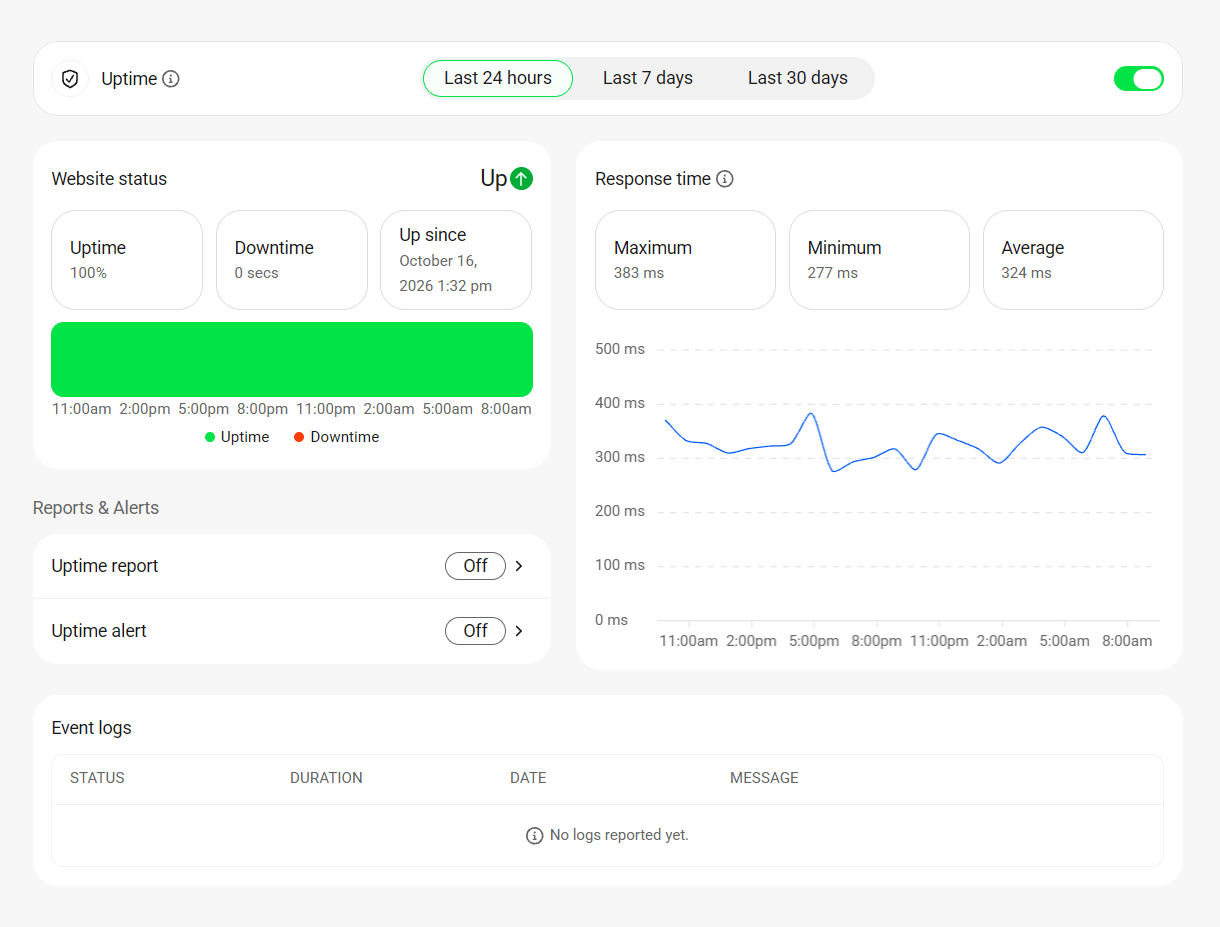
To learn how to enable Uptime notifications and schedule regular reports, see the Reports & Alerts chapter below.
Note that this feature requires a connection to the WPMU DEV API. So if the WPMU DEV Dashboard plugin is installed on your site but not yet active, or you’re not logged into it, you’ll be prompted to do that first. If the WPMU DEV Dashboard is not installed on your site or you’re using the free version of Hummingbird from wordpress.org, click your profile icon in the Hummingbird header and either create a new free WPMU DEV account or log in to an existing one.
Response Time
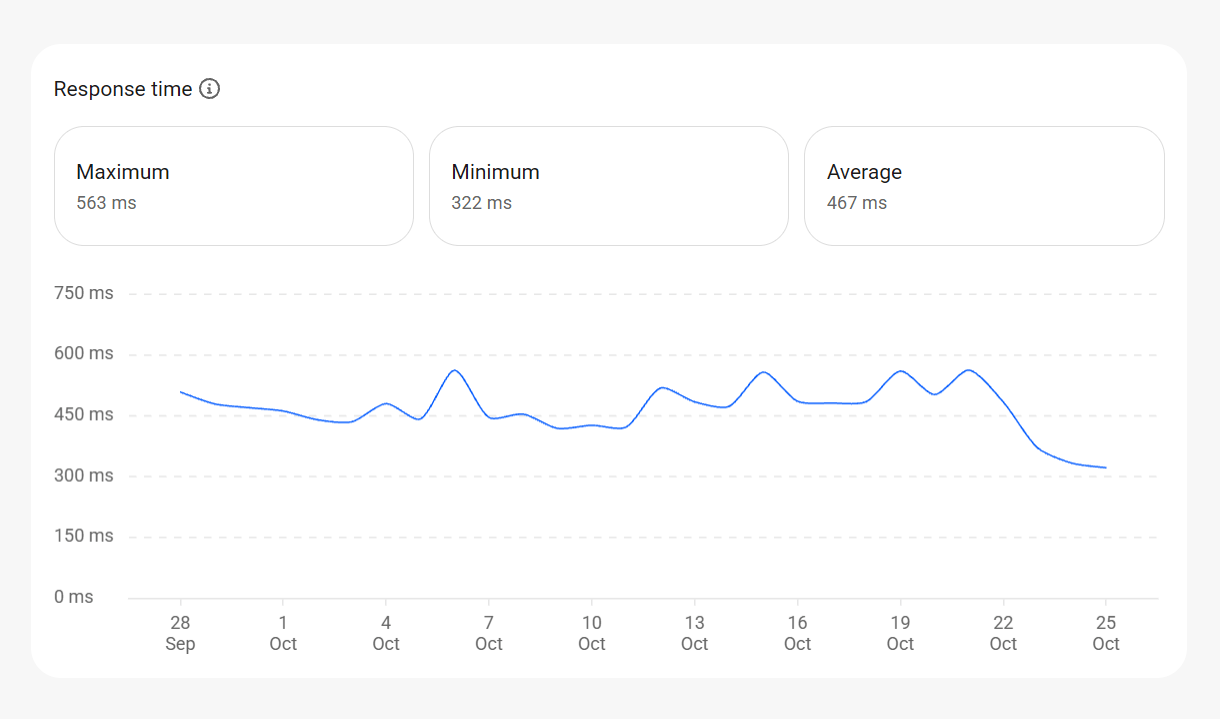
At the top of the Uptime section, you’ll notice some key pieces of information regarding your site. If this is the first time you’ve turned on Uptime Monitoring, it’s possible that there won’t be much information to see.
Beneath this, you’ll find a graph of the response time of your site at various times throughout the reporting period:
Downtime
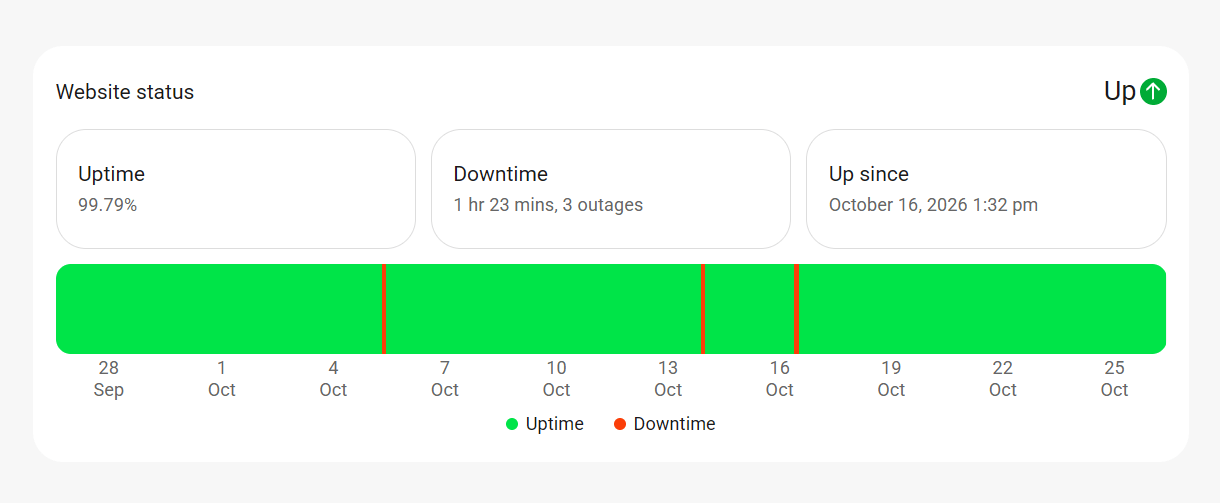
Uptime monitoring pings your site every 2 minutes from our server in Virginia, USA, and if your site did not respond or your homepage took more than 30 seconds to load, it will consider your site down. If, on the other hand, everything works and loads normally but you are still getting Uptime notices, please check your server and/or plugin Firewall and add the Uptime IP addresses to your allowlist.
For the full list of all WPMU DEV IP addresses you may need to allow in your firewall, see our WPMU DEV IP Addresses doc.
Note that the pings from Uptime are excluded from tracking data in your Hub and do not count as visits in the Analytics tracking section for your site. Other tracking platforms may count the pings though, but they would be counted as a single visit per day as the IP is always the same.
From the Downtime tab, you can see the report about your past downtimes and stats. It also will show you how long your downtime lasted.
Potential Cloudflare Issues
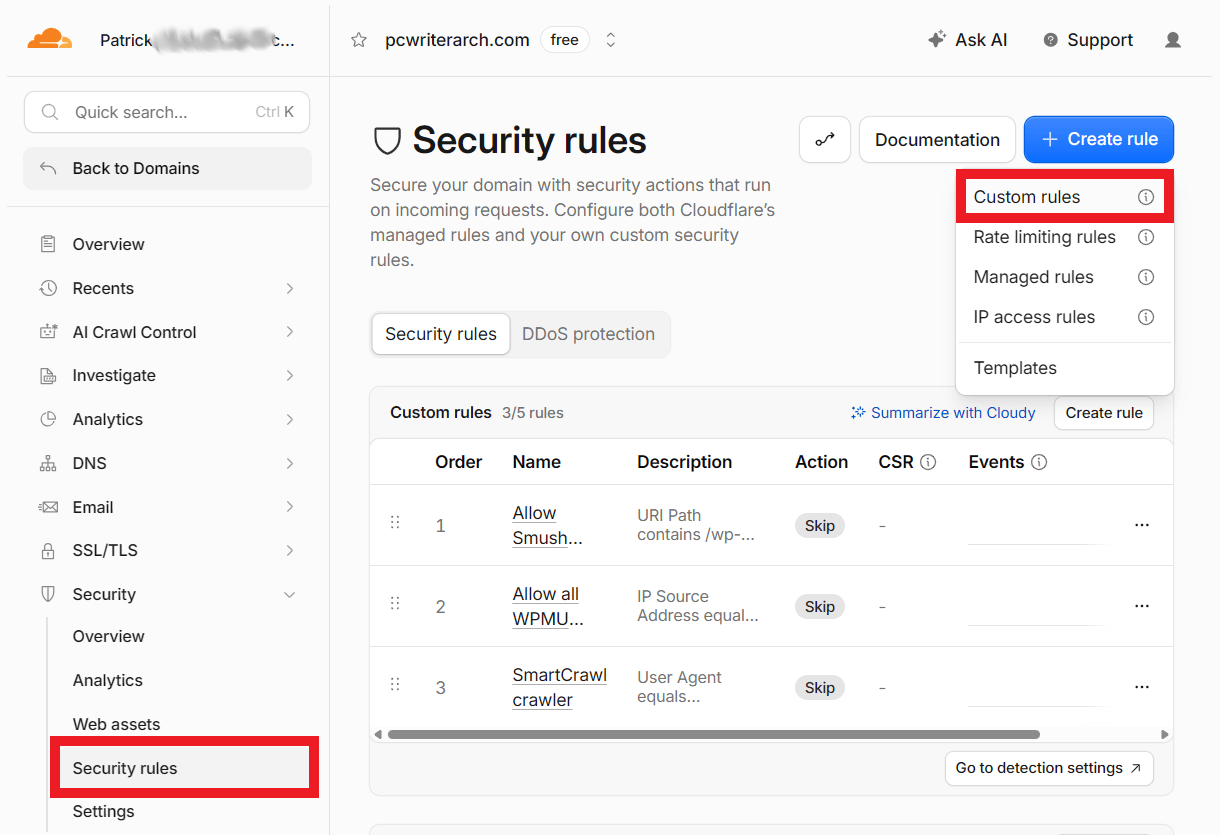
- If your domain is routed through Cloudflare, add the WPMU DEV IP addresses to a custom rule under Security > Security rules > Custom rules.
- If your domain is routed through Cloudflare and you have a firewall enabled on your server as well, add the WPMU DEV IP addresses to both Cloudflare and the server firewall. Cloudflare IP addresses should be allowlisted on the server firewall as well to prevent any blockage.
- If your domain is routed through Cloudflare and you have Bot Fight Mode enabled there, see the Bot Fight Mode enabled? note in our WPMU DEV IP Addresses doc.
Uptime User Agent
If you ever need to allowlist the user agent used by the Uptime Monitor in your robots.txt file or a firewall, it is called: WPMUDEV Uptime Monitor 5.0 (https://wpmudev.com)
2.6.2 Database Cleanup
Link to chapter 6WordPress saves some less necessary things on your database, like post revisions or spam comments. If you have a big website, those things can become very big and slow down your website. This feature allows you to address that problem by cleaning your database.
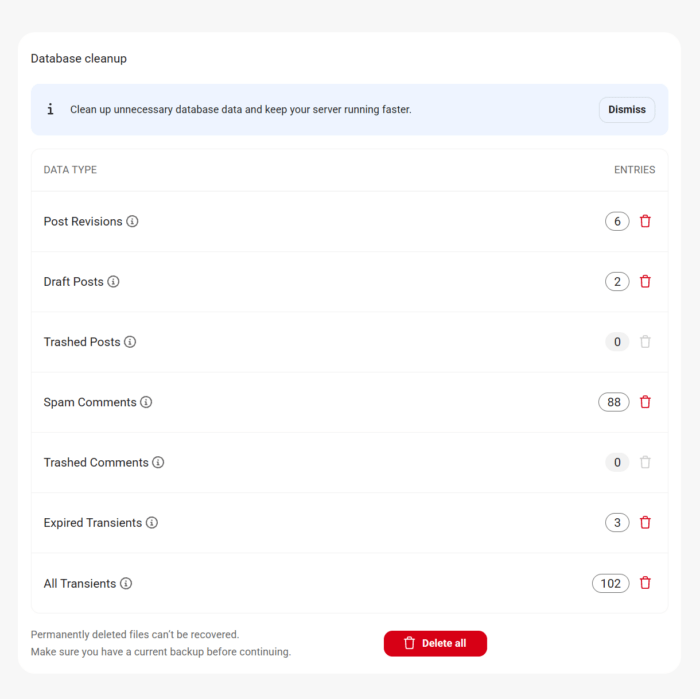
You can delete specific sections by clicking the trash icon for each one, or you can delete all of them from the Delete All button.
Note that, to help prevent accidental deletion of draft posts, clicking the trash icon to clear Draft Posts entries from your database will move those drafts to the trash; it will not delete them. To delete them permanently afterwards, use the Trashed Posts option.
Scheduled cleanup
The Scheduled Cleanup settings enable you to specify which tables should be included in scheduled database cleanups and corresponding reports.
- Post Revisions
- Draft Posts
- Trashed Posts
- Spammed Comments
- Trashed Comments
- Expired Transients
- All Transients
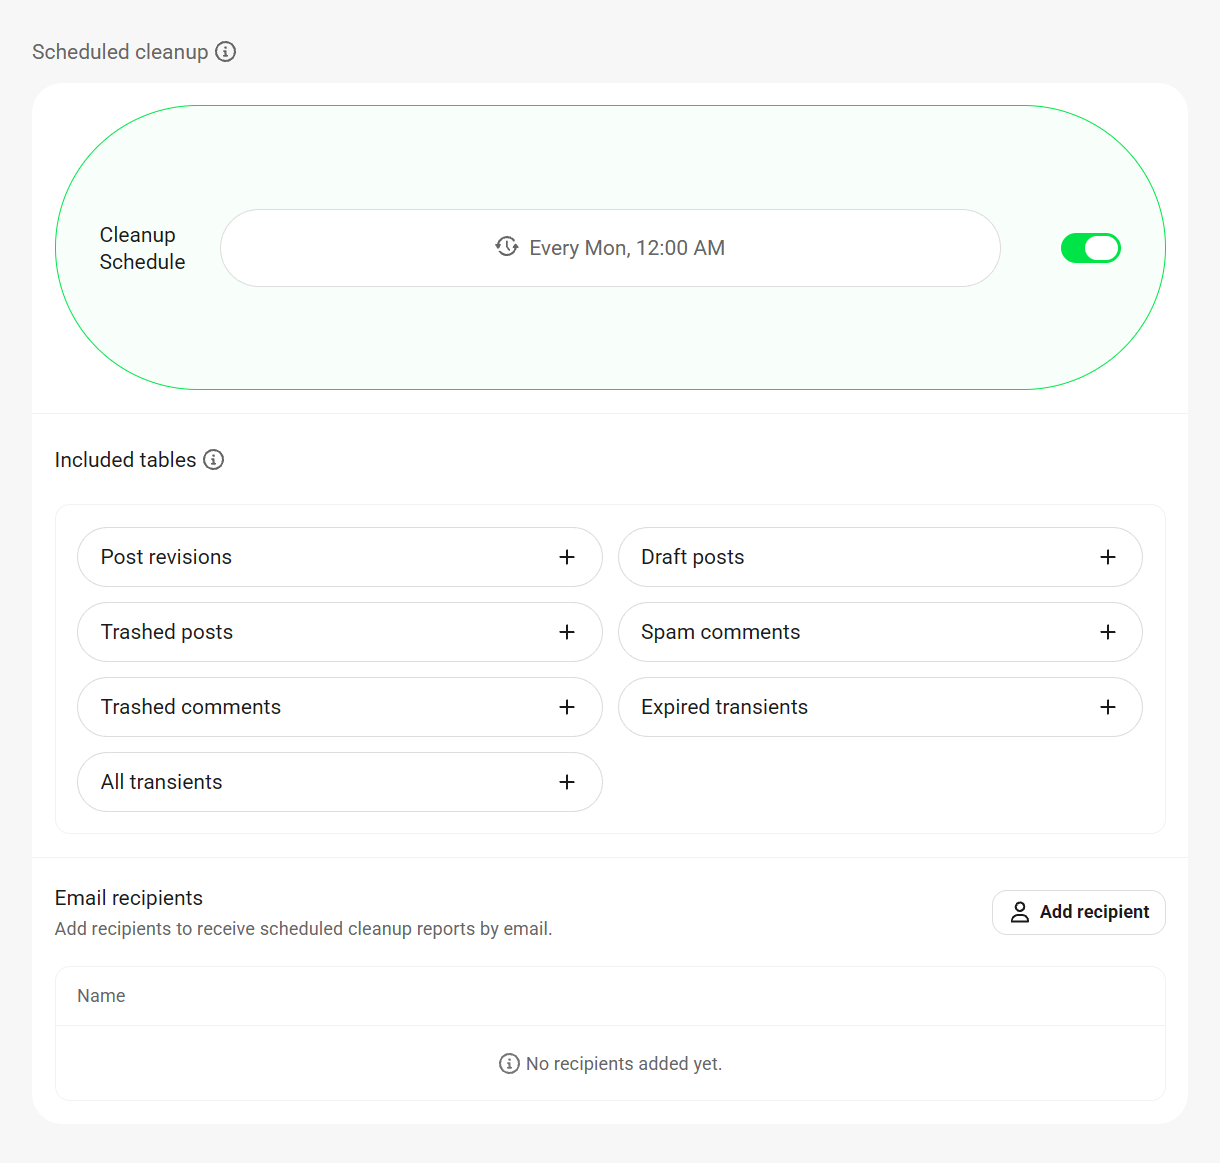
Toggle on the option and set your preferred daily, weekly, or monthly schedule for automatic regular database cleanups.
Select which tables should be included in reports, and click the Add recipients button to specify users who should receive them.
2.6.3 Tools
Link to chapter 6Performance tweaks
Viewport meta optimization
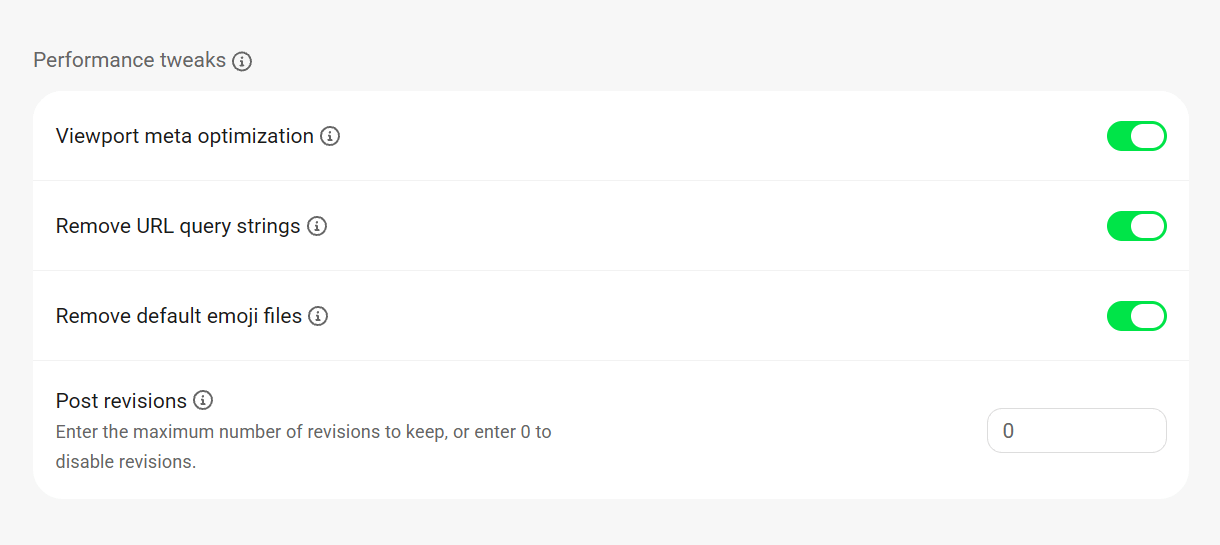
Enabling this feature automatically applies the viewport meta tag to all the pages on your site, improving mobile responsiveness and Core Web Vitals scores.
Remove URL query strings
Some of your resource URLs can end with something like “?x=y”, these are the query strings of the URL. Some servers, CDNs or caching systems don’t like query strings and removing them can help to increase speed. Enable this option by toggling on Remove URL query strings.
Remove default emoji files
By default, WordPress has its own emoji set and loads custom CSS/JS files to convert symbols to emojis. You can remove those files with this feature which will result in faster load times.
Post revisions
To restrict the number of revisions for each post, specify the maximum number of revisions to be stored in the Post revisions field. For example, entering 5 will retain the last 5 post revisions. If you wish to disable post revisions, enter 0.
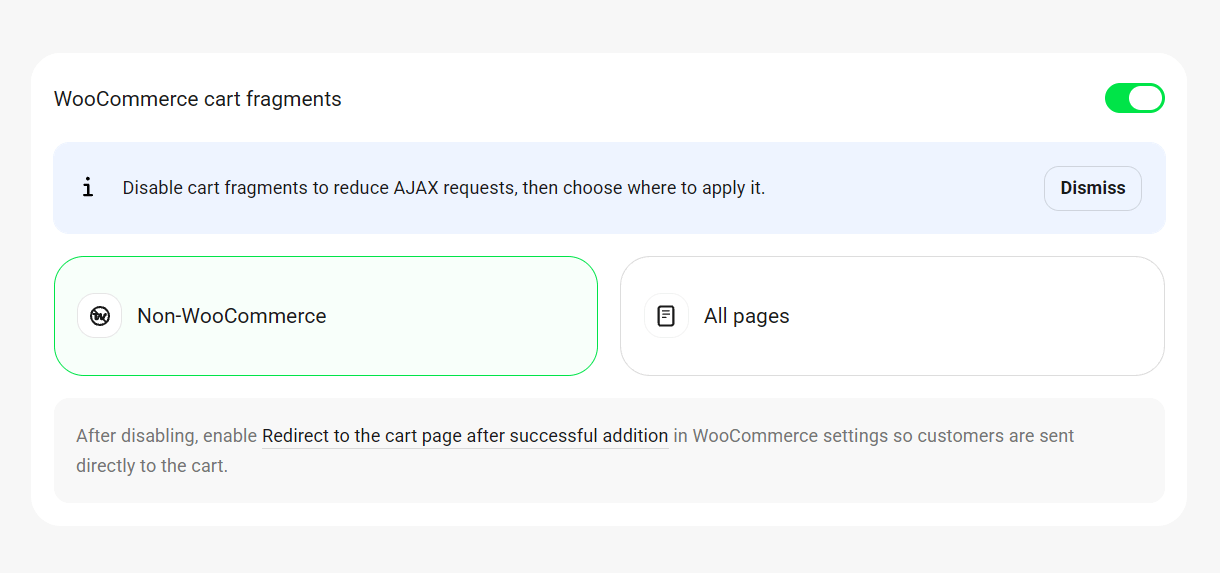
WooCommerce Cart Fragments
WooCommerce uses ajax calls to keep the cart numbers up to date even when the page isn’t refreshed. This is super useful on WooCommerce pages but we highly recommend disabling cart fragments on all other pages as it can drastically slow down your page speed.
Lazy Load
Lazy loading delays loading specific content to speed up the overall page speed. In particular, sites with lots of comments, iframes and images can delay your page speed over time.
Be sure to also activate Lazy Load in our Smush plugin, especially for media-heavy sites, to get the most out of this feature.
Lazy load comments
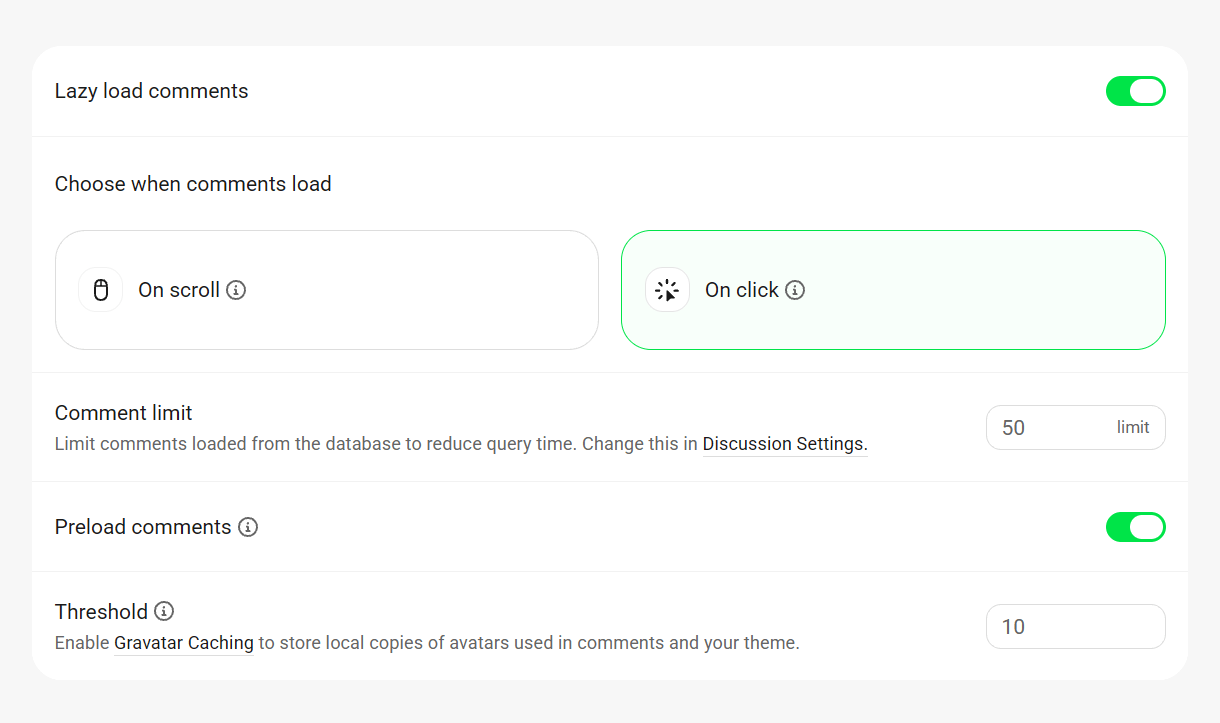
Loading comments using the native WordPress comment system can slow down your page speed dramatically. Click the Lazy load comments toggle to enable this feature and reveal the configuration options to help boost your page load speed.
Choose when comments load
Select the lazy loading method you prefer:
- On scroll – This method will automatically load the comments section when it scrolls into view.
- On click – This method will require the visitor to click a button to load up the comments.
Comment limit
The comment limit displays the number of comments that are set to be pulled from your database.
Grabbing too many comments from the database can result in a slower page speed, so it may be beneficial to limit the number of comments and minimize the query time. This can be changed in Settings > Discussion in your site’s wp-admin.

Preload comments
Enabling this option will preload the first page of comments.
Threshold
While the comments limit controls how many comments are lazy loaded, the threshold controls how many comments are required for the lazy load feature to kick in.
Make sure you have Gravatar cache activated as well, which will store copies of the avatars used in comments and further speed up your page load time.
DNS tweaks
Prefetch DNS Requests
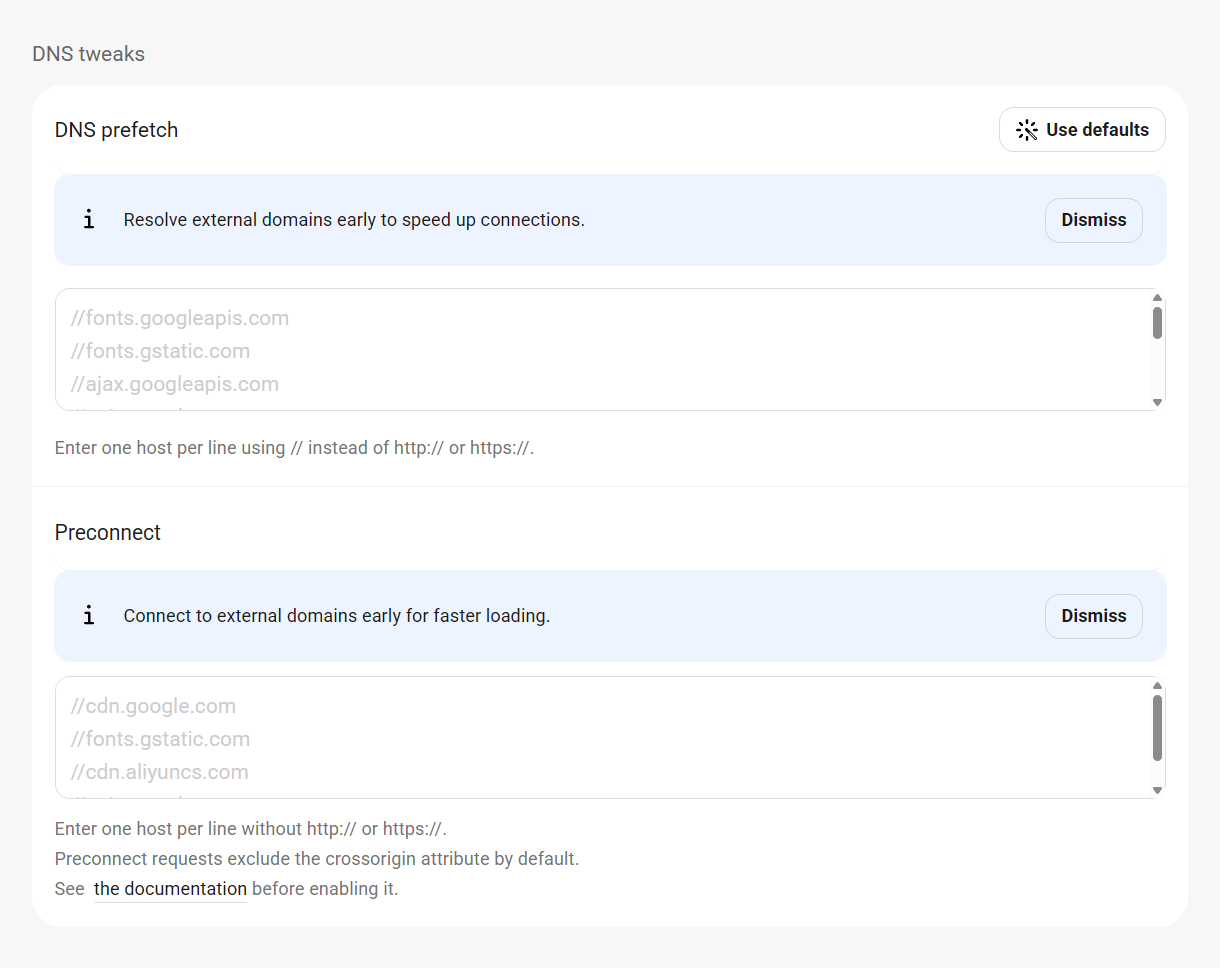
If you are using third-party services like Google Fonts, Youtube or Google Analytics, telling the browser to prefetch that service’s DNS can help to load your pages faster. Click Use defaults to automatically add the most commonly used third-party services. Enter any others you need without the protocol (use only //), one per line.
Preconnect
If your site loads resources from other domains, using Preconnect can provide a faster page loading experience for your users. It tells the browser to set up early connections in the background to lower latency.
By default, preconnect requests are made without the crossorigin attribute. The crossorigin attribute indicates to the browser that resources on the connection are loaded using Cross-Origin Resources Sharing (CORS), which improves web security. If you’d like to make a preconnect request with this attribute, add the word crossorigin at the end of the relevant host; e.g. – //example.com crossorigin
2.6.4 Reports & Alerts
Link to chapter 6Performance reports
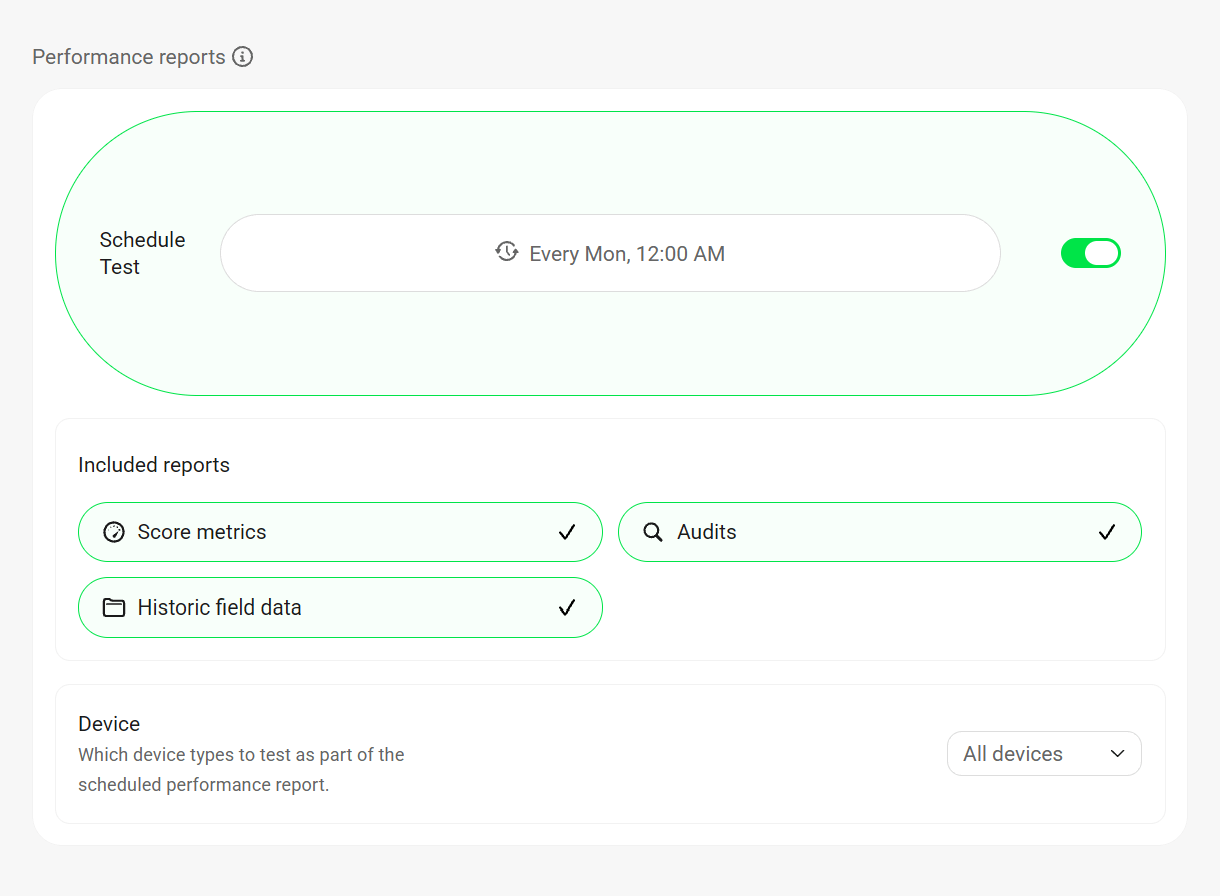
The Performance report settings enable you to schedule Daily, Weekly or Monthly reports and select the Day of the week and Time of day the report should run.
Then specify the Device type you wish to receive reports for: only Desktop or Mobile devices, or Both. You can also specify the test Results you want included in your reports: Score Metrics, Audits and/or Historic Field Data.
Uptime reports
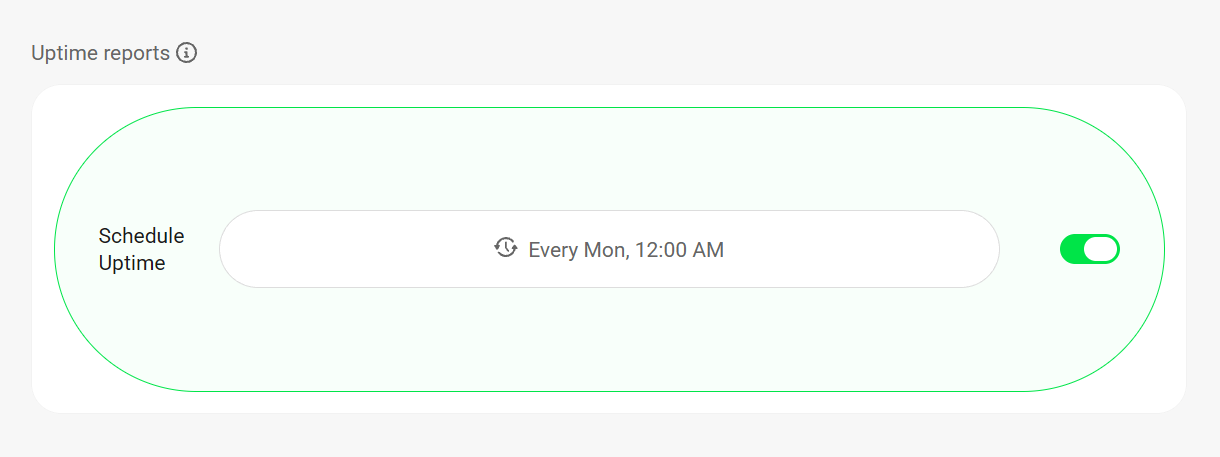
The Uptime report settings enable you to schedule Daily, Weekly or Monthly reports and select the Day of the week and Time of day the report should run.
Uptime alert
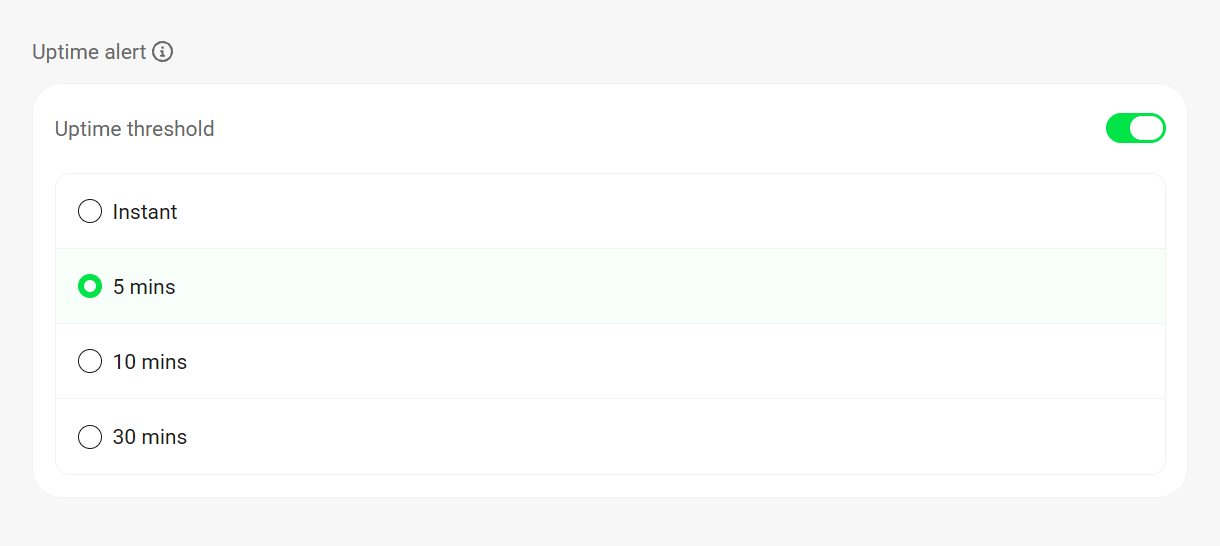
Specify for how long a site should be down before Uptime sends an alert. You can choose to get an Instant alert (Pro only), or if the site is down for 5, 10, or 30 minutes.
Recipients
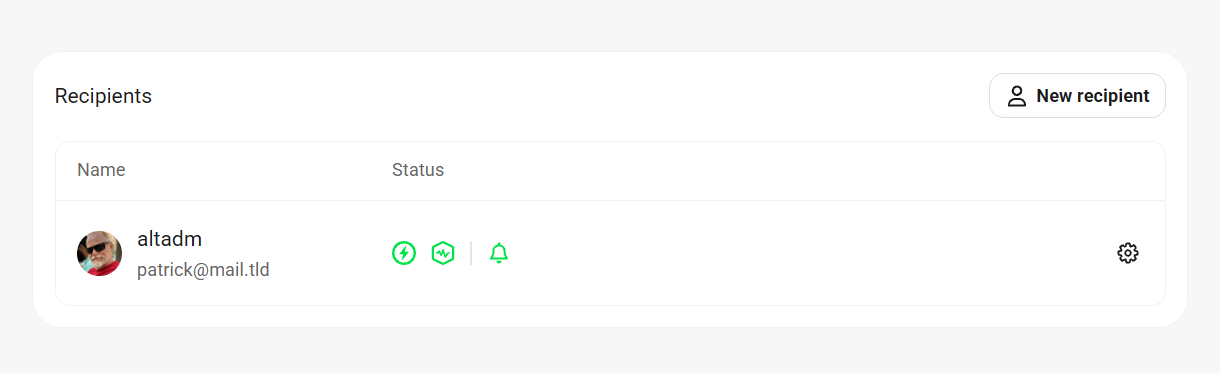
Click the Add recipient button to add any existing user from your site, or invite recipients by email.
2.7 Settings
Copy chapter anchor to clipboardThe Settings section enables you to change the default Hummingbird settings for configs, plugin data, accessibility, and more.
2.7.1 Configs
Link to chapter 7The Configs module allows you to save your Hummingbird configurations so that they can be applied to another site in just a few clicks.
To help you get started, we provide a Default config which includes the recommended settings that are ideal for fresh installations.
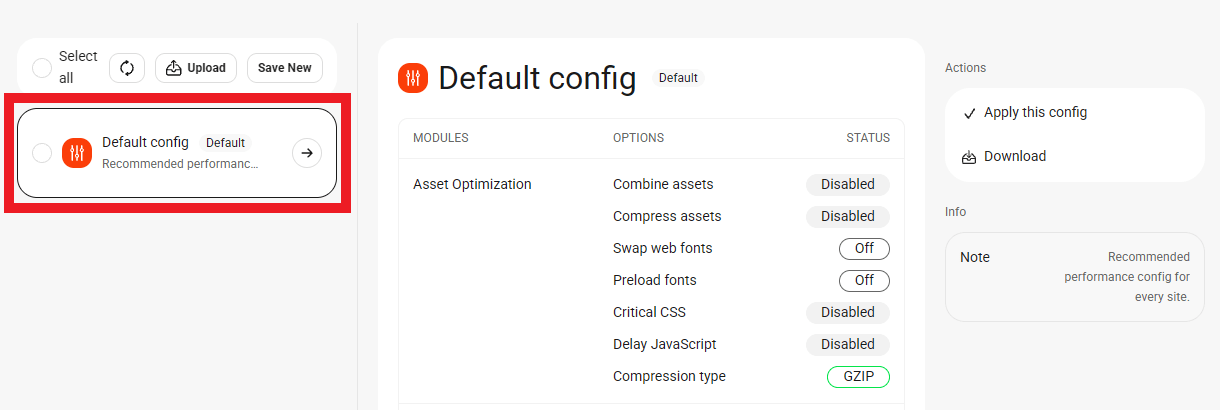
Configurations are listed alphabetically. To view details about any configuration, simply click on it in the list.
Save a configuration
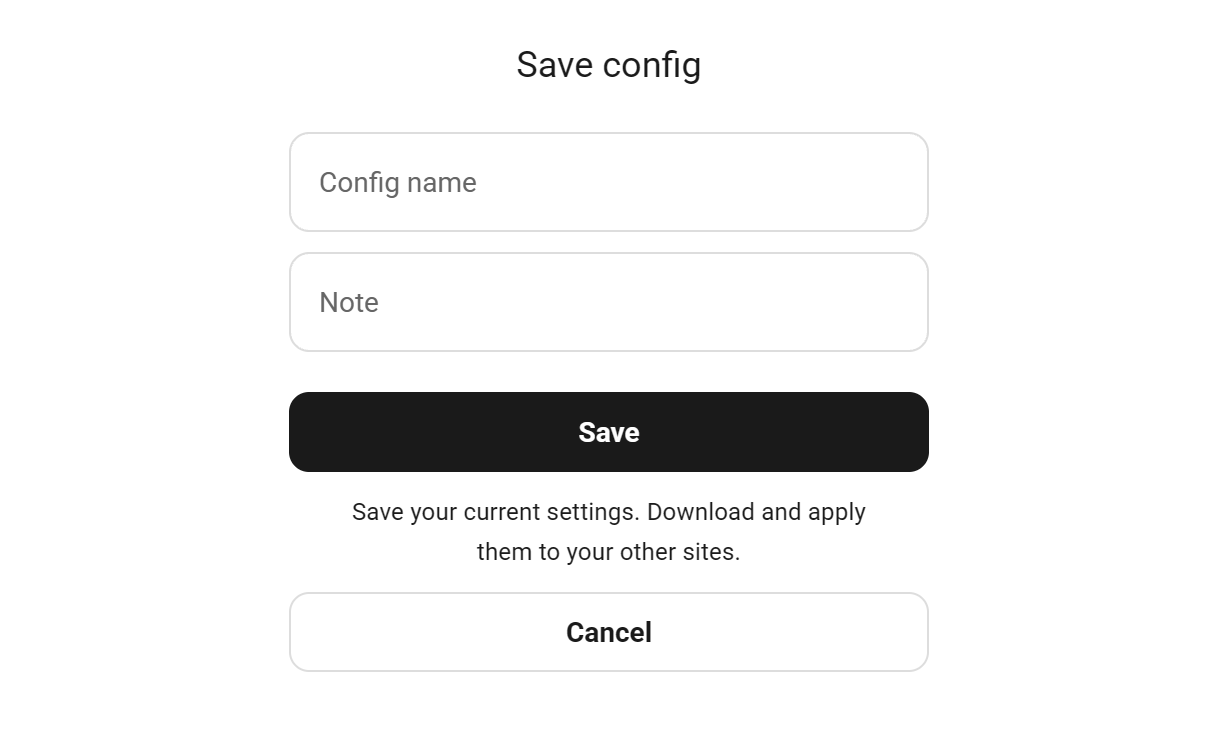
To save your current configuration, click Save new.
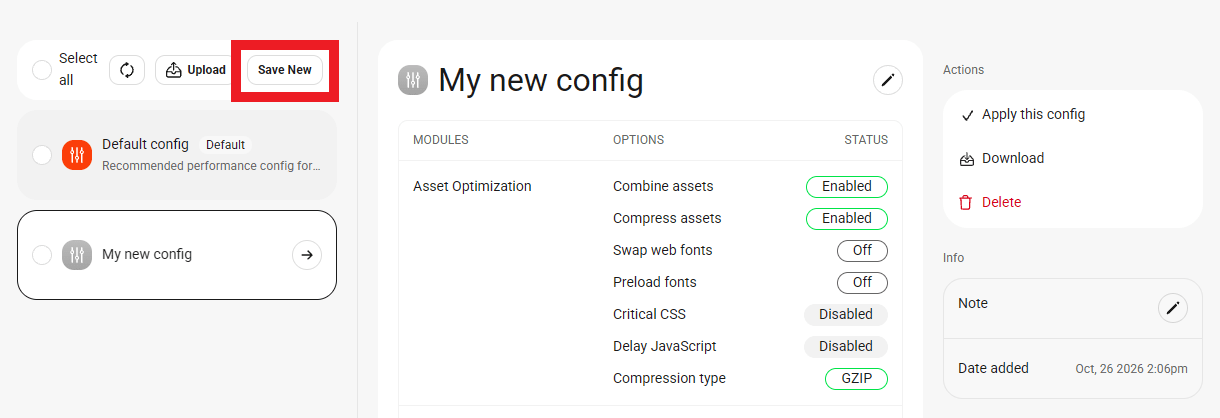
In the panel that slides open, enter a name and optional note for the configuration and click Save.
Upload a configuration
To upload a configuration that you’ve downloaded from another site, click Upload, and select the relevant .json file from your computer.
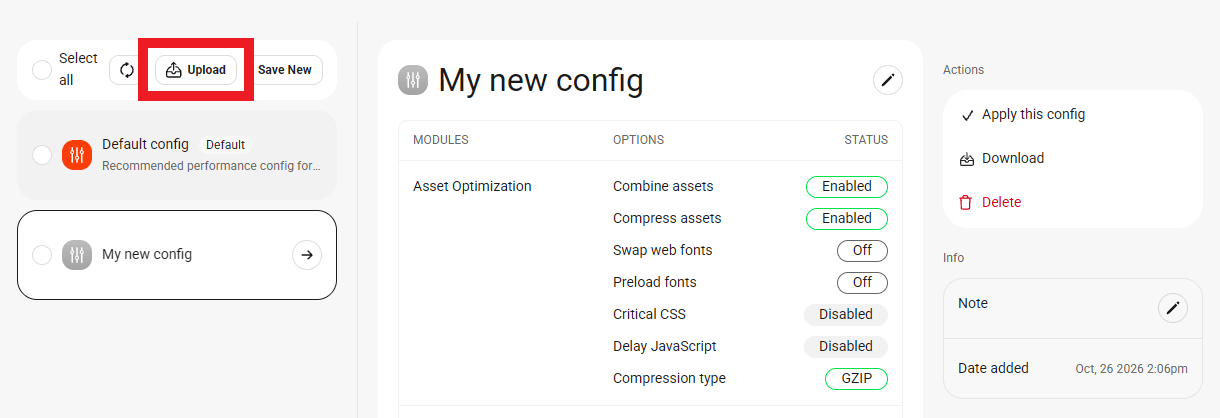
Hummingbird will import the uploaded configuration and add it to the Preset Configs list.
Apply a configuration
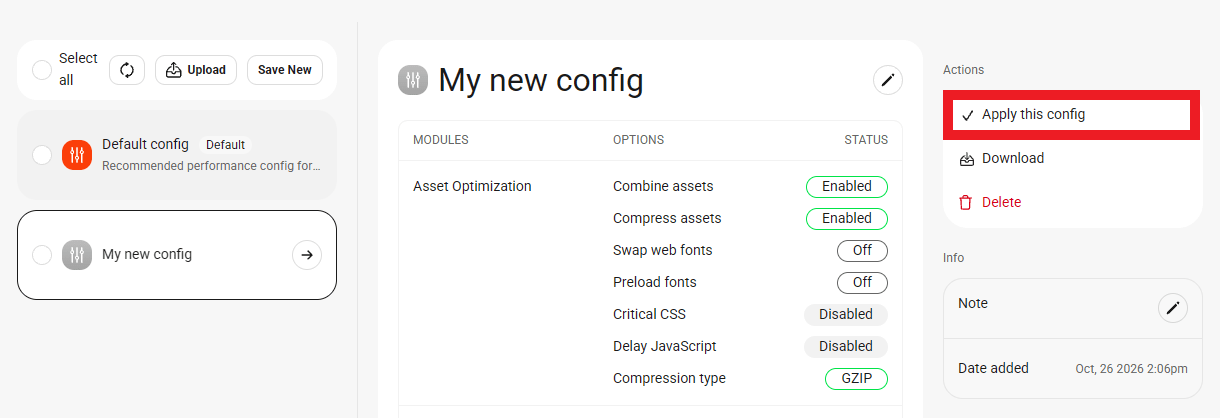
To apply a Hummingbird configuration to your site, click on the one you want to open the details pane, and click Apply this config. You’ll be prompted to confirm the action.
Additional options
To edit the name and/or note of a configuration, click the corresponding pencil icon. Click Download to download the configuration as a .json file to your computer. Click Delete to permanently delete the configuration; you’ll be prompted to confirm the action.
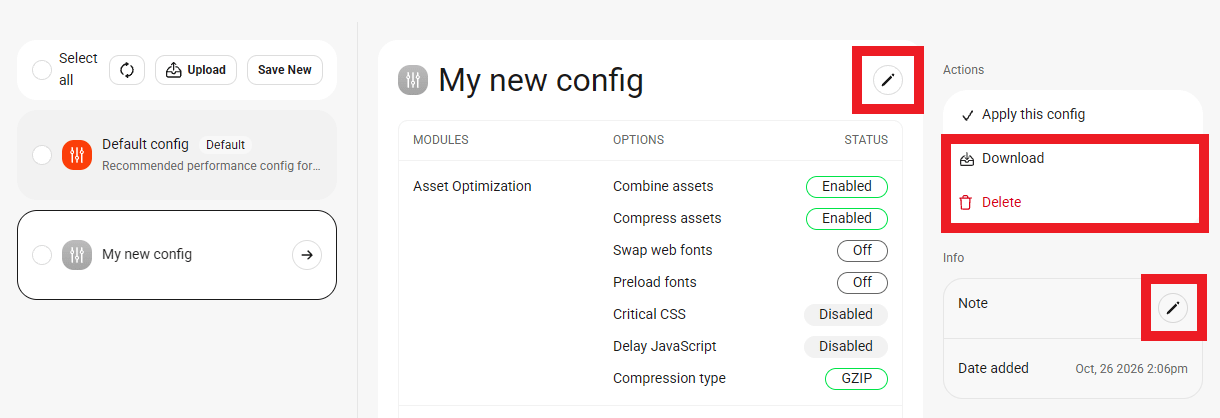
Sync with the Hub (Pro Only)
Hummingbird configurations will automatically be synced with the Hub. Synced configs can be accessed and applied directly from the Config or Security modules in the Hub, or from the Hummingbird installation of any of your sites.
If a new config created in the Hub doesn’t appear immediately in the Hummingbird Settings module, click the spinner icon to refresh your data.
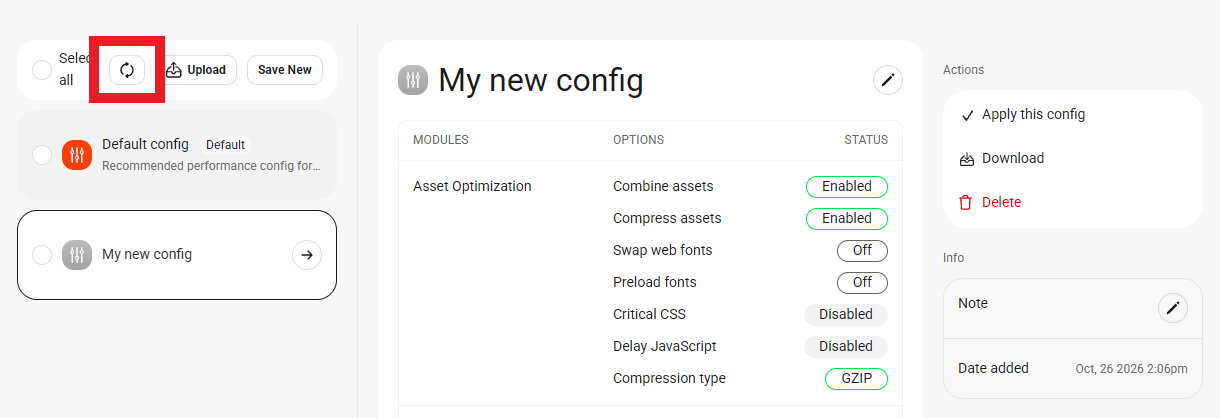
Settings and Options Stored in Configs
In the list below, you’ll find a breakdown of all settings included in the config file. Some settings offer predefined options, while others store values that you manually enter (such as numbers or durations).
Page Caching
- Page Caching: Active/Inactive
- Page Cache – File change detection: Auto | Manual Notice | None (Single value is stored)
- Gravatar Caching: Active/Inactive
- Purge Varnish cache: Active/Inactive
- Purge OpCache: Active/Inactive
- Cache preloading: Active/Inactive
- RSS Caching: Active/Inactive
- RSS Duration: User-defined number in seconds (Single value is stored)
Advanced Tools
- Remove query strings from assets: Active/Inactive
- Disable WooCommerce cart fragments: Active/Inactive
- Viewport Meta Optimization: Active/Inactive
- Post Revisions: User-defined number of revisions (Single value is stored)
- Remove the default Emoji JS & CSS files: Active/Inactive
- Comments lazy loading: Active/Inactive
- Comments lazy loading method: On Click | On Scroll (Single value is stored)
- Comment lazy load threshold: User-defined number (Single value is stored)
Uptime
- Uptime: Active/Inactive
Settings
- Cache control in admin bar: Active/Inactive
- Allow usage tracking: Active/Inactive
- Remove settings on uninstall: Active/Inactive
- Remove data on uninstall: Active/Inactive
- High contrast mode: Active/Inactive
2.7.2 Others
Link to chapter 7Accessibility
This feature will improve the visibility of elements as per the Web Content Accessibility Guide requirements, up to level AAA which is the highest level of compliance. Toggle on High (AAA) contrast mode to activate this mode.
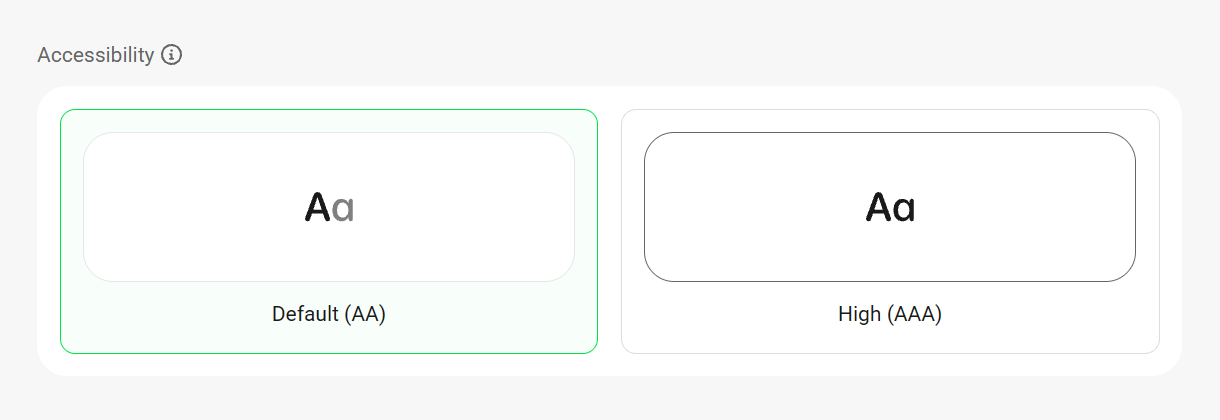
Enable debug log
The debug log contains information that can be very helpful in case something goes wrong. Once logs have been generated, you can download or trash them from this settings screen. If needed, you can also access the data in your site’s wp-content/debug.log file.
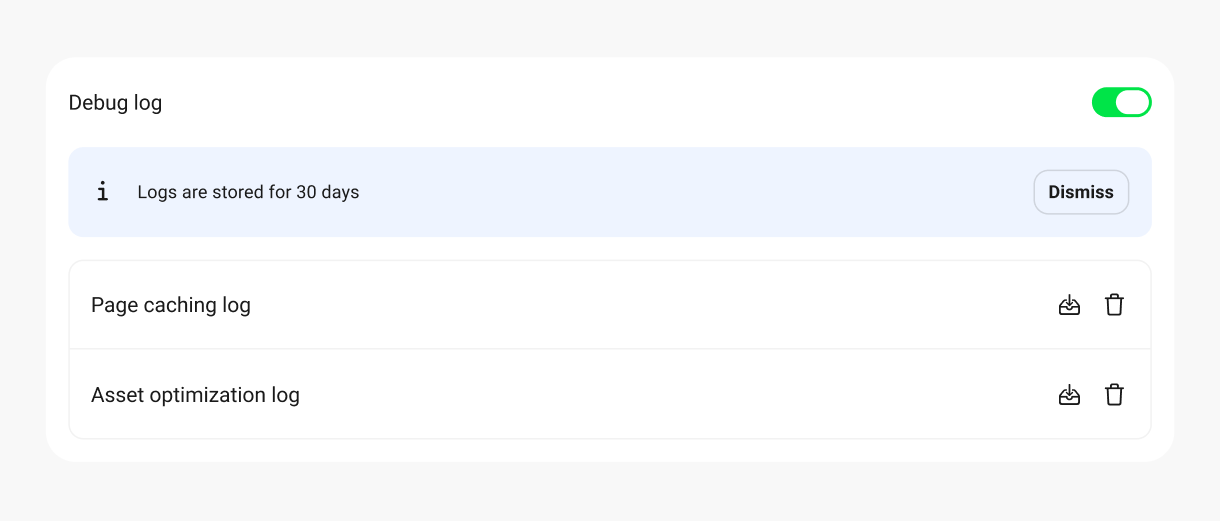
Clear cache shortcut
When enabled, this option adds cache clearing shortcuts to the Hummingbird menu in your WordPress Admin bar.
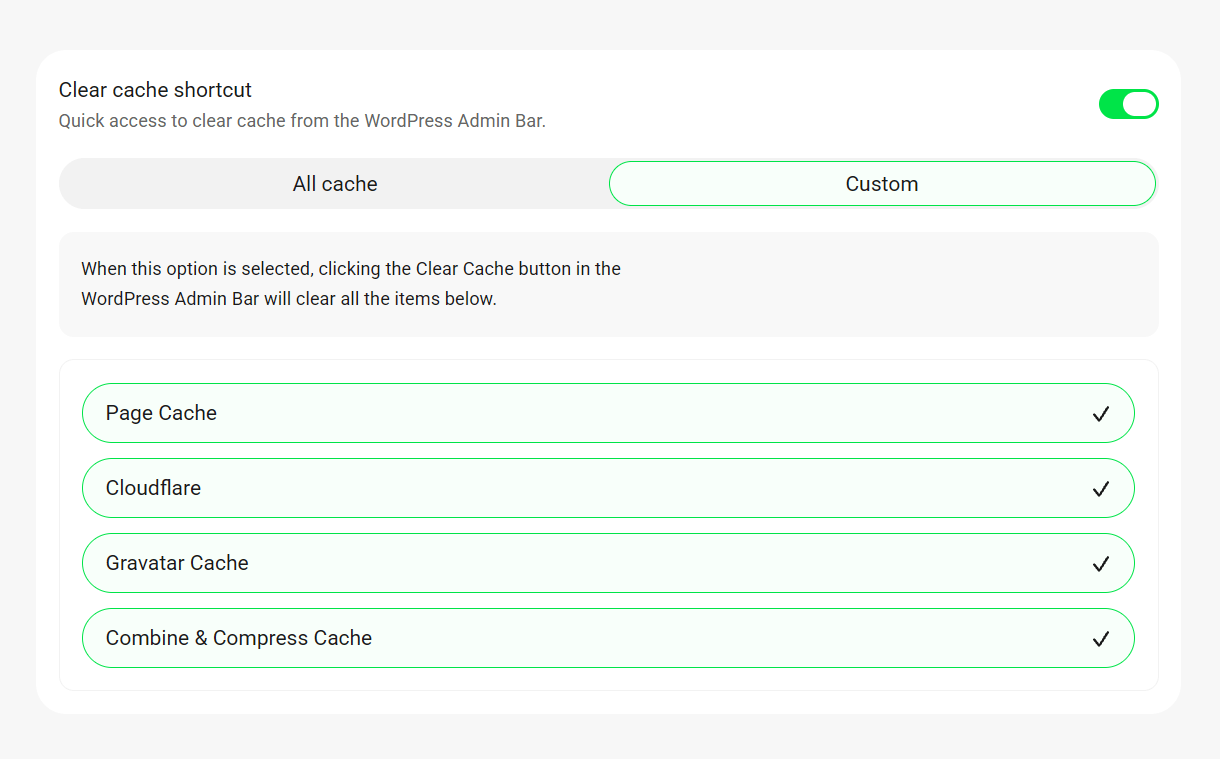
If All cache is selected, then the Admin bar will include a shortcut to clear all active cache types.

If Custom is selected, then the Admin bar will include shortcuts to individually clear selected cache types.
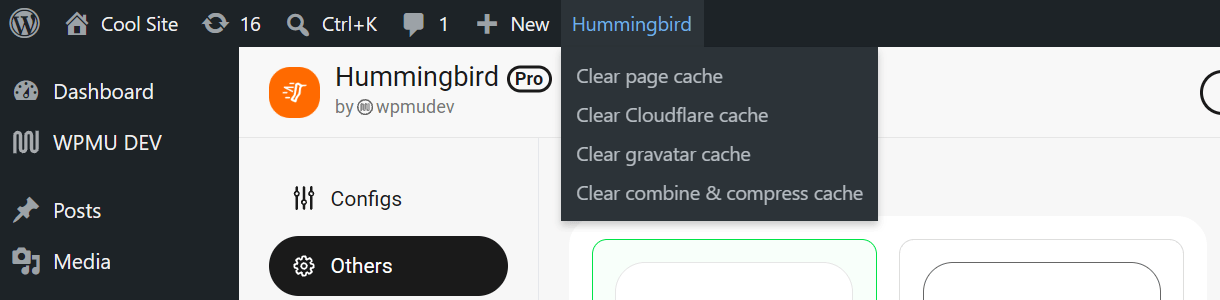
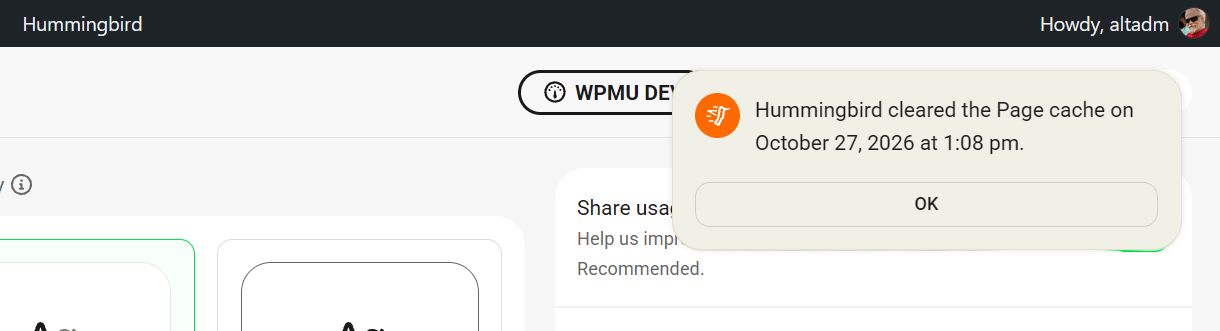
After clearing cache from the Admin bar, you will see a confirmation notice at the top of the screen. The notice shows which cache type was cleared and the date and time of the action.
Additional settings
Share usage data
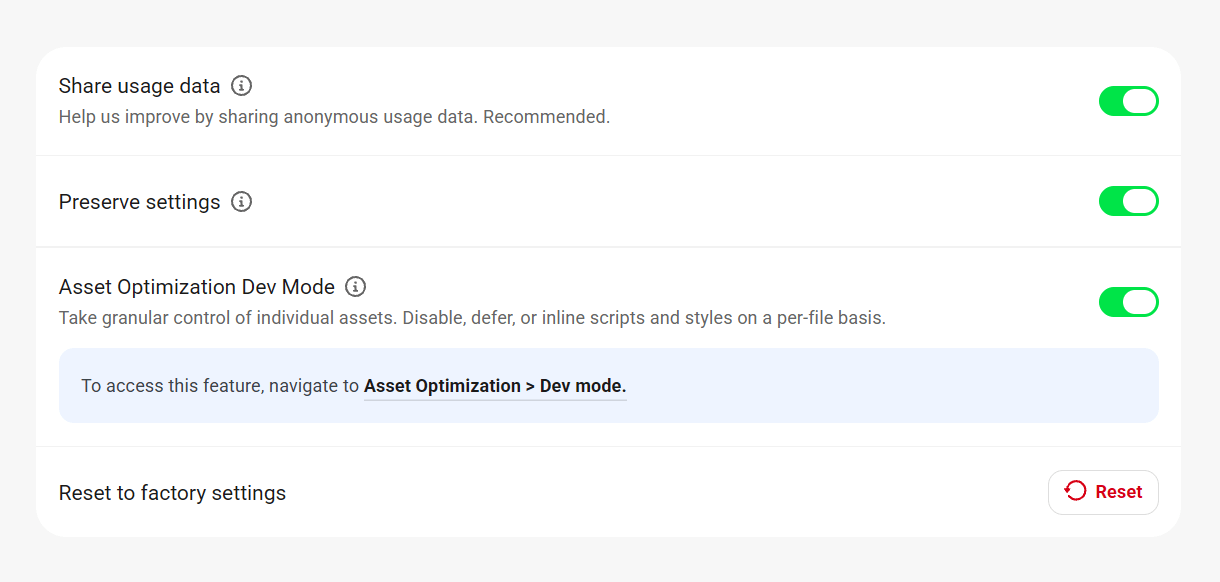
Sharing usage data is incredibly useful for our designers, and enables us to learn more about what features you use and don’t use. It is a completely anonymous feature, and helps us deliver more relevant features in the future. See our Privacy documentation for more information about the data we collect.
To enable sharing, simply toggle on the option.
Preserve settings
Enable this option before uninstalling the plugin if you want to preserve your current settings when you reinstall it at a later time.
Asset Optimization Dev Mode
Toggle this option on if you prefer to have full optimization control over every CSS, JS and font file in your system.
Before switching, you’ll see a confirmation modal reminding you that manual configuration can potentially break your site if used incorrectly. Click Switch to Dev Mode to proceed.
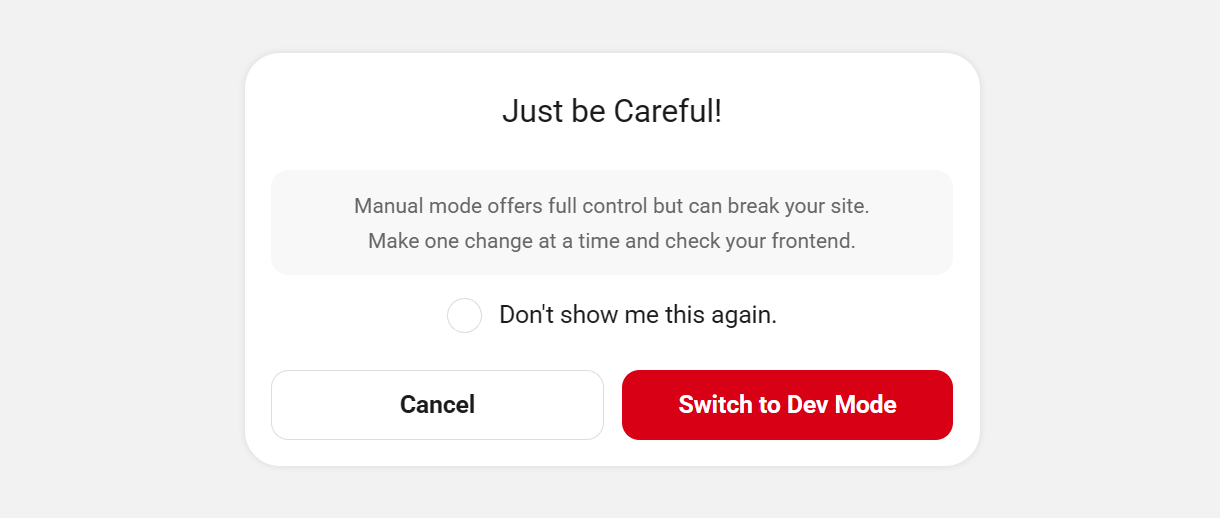
See Dev mode above for more information.
Reset to factory settings
If you want to reset Hummingbird to how it was when you first installed it, you can use this button to do so.
2.8 Multisite
Copy chapter anchor to clipboardWhen Hummingbird is network-activated in a multisite installation, most of the features that are available in the network admin will only affect the main site once enabled. Features can be enabled and managed on each individual subsite.
The exceptions to this are detailed in the subchapters below.
2.8.1 Asset Optimization
Link to chapter 8Subsites
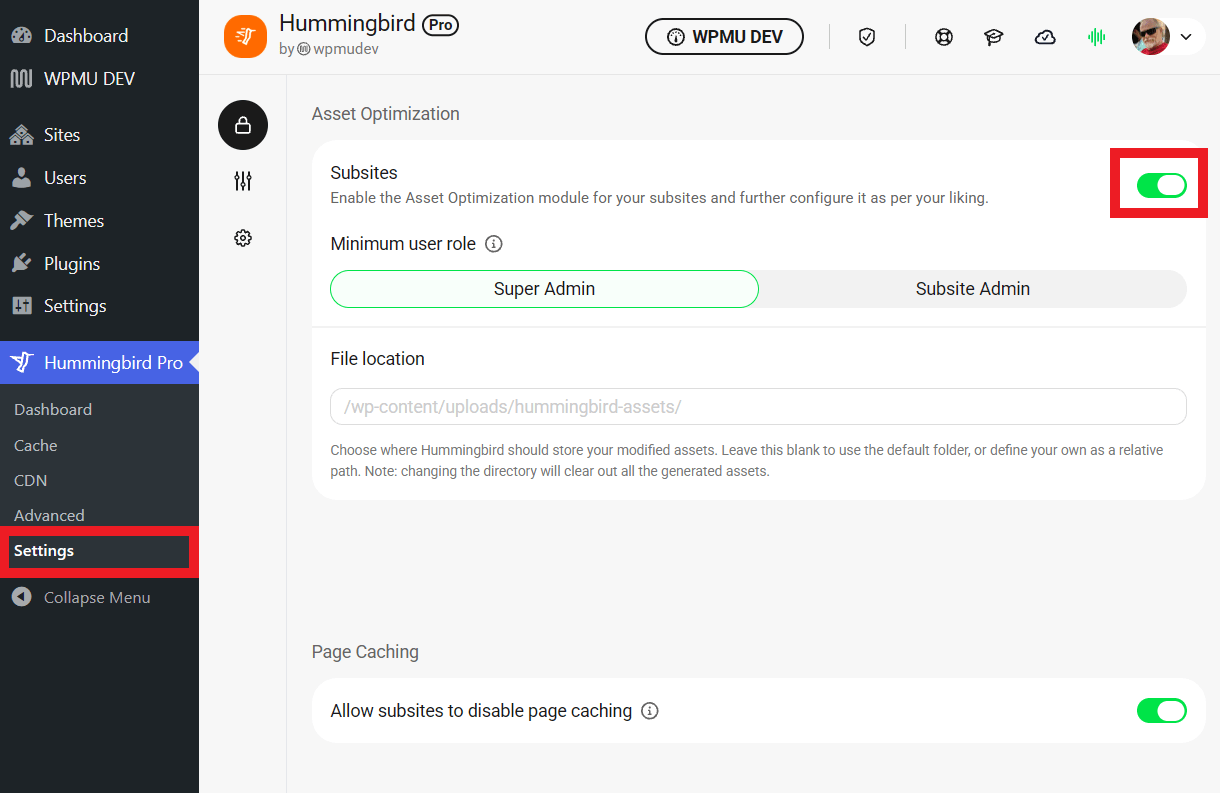
Asset optimization can only be configured on a per-site basis. But in a multisite installation, Asset Optimization for subsites must be enabled in the network admin before the module is available in main site and subsite menus.
To do so, go to Hummingbird > Settings > Permissions in your Network Admin. Click the toggle next to Subsites and select whether the minimum role should be super-admin or admin.
File Location
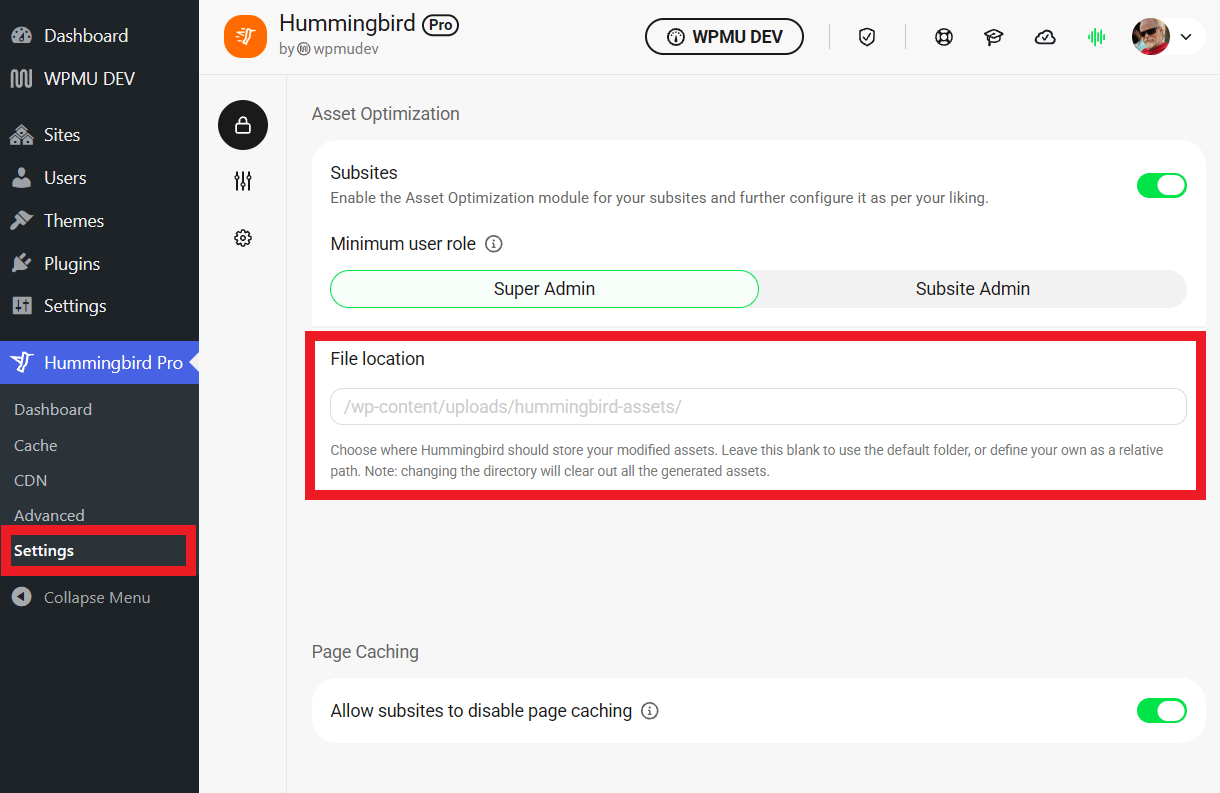
By default, Hummingbird will store your modified assets at /wp-content/uploads/hummingbird-assets. Use this option if you want to change that in your multisite installation.
Go to Hummingbird > Settings > Permissions in your Network Admin, and enter your desired file location as a path relative to your document root.
Note that if the WPMU DEV CDN is enabled in your multisite, files will be served from the CDN, not the location you set here.
2.8.2 Page Caching
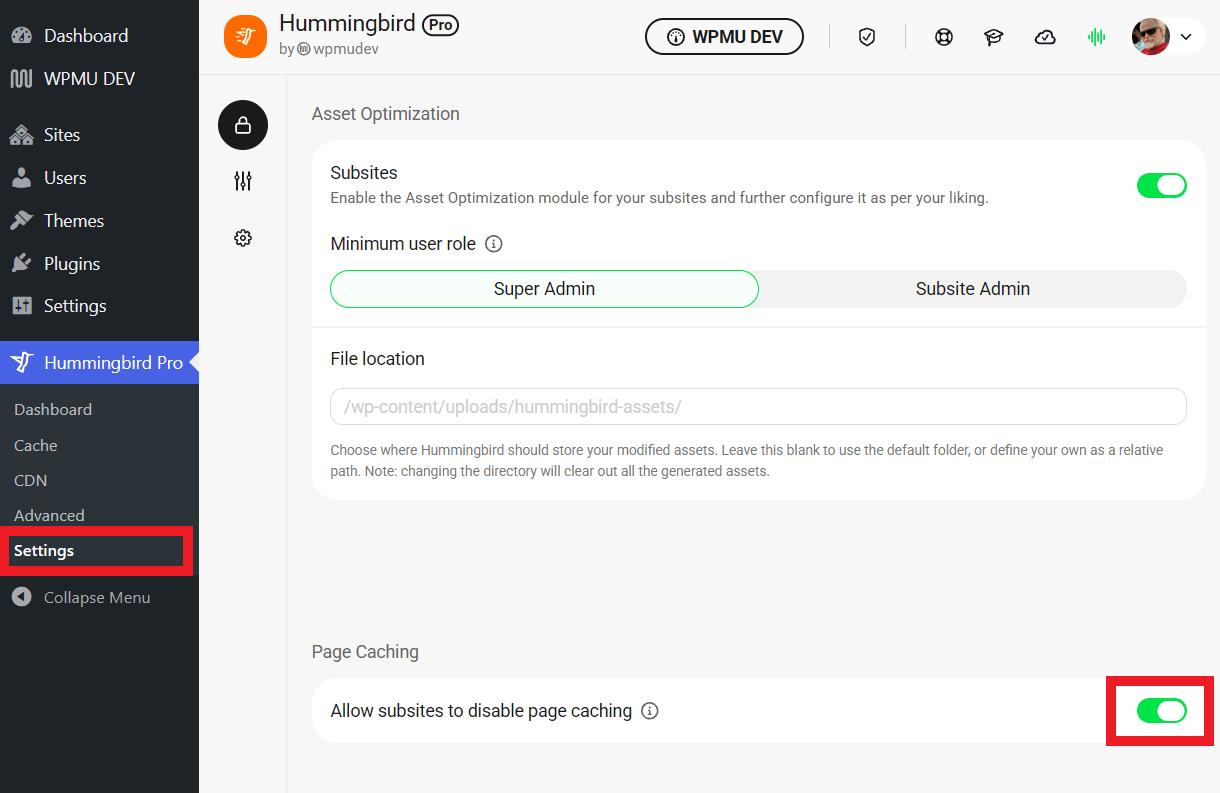
Link to chapter 8By default, subsite admins cannot disable Page Caching for their sites. To allow network or subsite admins to disable Page Caching for their sites, go to Hummingbird > Settings > Permissions in your Network Admin, and click the toggle next to Allow subsites to disable page caching.
2.8.3 Configs
Link to chapter 8Since configs apply to the whole network, they are only accessible in the network admin of multisite installations.
2.8.4 Other Settings
Link to chapter 8Clear cache shortcut
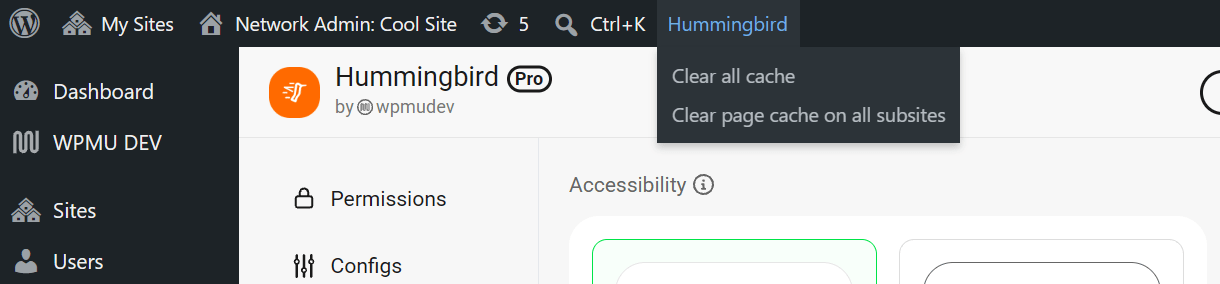
In multisite installations, the Clear cache shortcut in the Admin bar will include a shortcut to clear the page cache for all subsites if the All cache option is selected.
2.9 Optimization Guide
Copy chapter anchor to clipboardAbout Your Google PageSpeed Insights Score
This chapter guides you through the best configuration options for optimizing file and code assets with Hummingbird Pro to improve performance based on asset optimization recommendations from the Google PageSpeed Insights performance scan.
Looking to optimize your image assets? See our Smush image Optimization Guide.
There are many variables when running a PageSpeed test on a real-world website, and it’s important to understand that not every site can expect a score of 100.
Ads, scripts, and network conditions will cause results to vary for each visit. It is important to note that some very valid tools, such as anti-virus scanners, complex extensions, programs that impact page load or inconsistent ad behavior, can all impact PageSpeed scores. In fact, we recommend that anti-virus scanners and any program known to interfere with pagespeed be disabled during PageSpeed tests.

The following are some general guidelines regarding Google PageSpeed scores:
- 0 to 49 is considered slow
- 50 to 89 is good or average
- 90 to 100 is fast
For context, a website with a score of 100 is in the 98th percentile of the million top-performing sites. A site with a score of 50 is in the 75th percentile, which is still quite good relative to the vast majority of websites.
So what should your performance success metric be? A realistic PageSpeed score expectation for your website must take into account your host’s servers, content location, the number scripts or third-party calls your page is making, and the plugins and theme you are running.
2.9.1 Enable text compression
Link to chapter 9Text-based resources, like JavaScript or CSS code files, should be served with compression to minimize total network bytes and reduce document request latency.
The Google PageSpeed test compresses each of your uncompressed files with GZIP to compute the potential savings.
If the original size of a response is less than 1.4KB or if the potential compression savings is less than 10% of the original size, then the file will pass the audit.
If you are failing the “Document Request Latency” audit, you can use Hummingbird Pro to activate Gzip compression. After installing Hummingbird Pro, visit the Gzip Compression tab.
If your Gzip is not active, Hummingbird Pro has options for activating Gzip on NGINX, Apache, and IIS servers. See the Text compression chapter above for details.
2.9.2 Preconnect to required origins
Link to chapter 9Preconnect, or dns-prefetch, tells the browser that your page intends to establish a connection to another origin and that you’d like the process to start as soon as possible.
This saves time on pages loading social sharing buttons (e.g., X, Facebook), video player embeds (e.g., YouTube, Vimeo), advertising iframes, analytics & metrics scripts, and more.
In Hummingbird Pro’s Advanced tools, activate Prefetch DNS Requests to pre-resolve DNS, and Preconnect to reduce latency.
2.9.3 Use efficient cache policy on static assets
Link to chapter 9If your site is not passing the “Uses efficient cache policy on static assets,” use the Browser caching feature located under the Cache menu item.
Browser Cache stores temporary data on your visitors’ devices so that they don’t have to download assets twice. This results in a much faster second time around page load speed.
Hummingbird Pro allows you to set the recommended expiration time (Google’s benchmark recommends 1 year or longer).
2.9.4 Minify JavaScript
Link to chapter 9JavaScript Minification is the process of removing whitespace and any code that is not necessary to create a smaller but valid code.
Developers use this additional code to make it more readable for humans but are unnecessary for loading the site.
Hummingbird Pro will minify your JavaScript files, generating a version that loads faster.
Your PageSpeed report lists unminified JavaScript files, along with an estimate of potential savings based on the comments and whitespace characters.
Use Hummingbird’s Asset Optimization to compress all your JavaScript files.
See Dev Mode Optimization Tips above for insight on how to do safely optimize your files in Dev mode.
2.9.5 Minify CSS
Link to chapter 9Minification is the process of stripping blank space or unnecessary characters or lines of code from your file to make it more compact. Developers use this additional code to make it more readable for humans but are unnecessary for loading the site.
Hummingbird Pro will minify your CSS files, generating a version that loads faster.
Your PageSpeed report lists unminified CSS files, along with an estimate of potential savings based on the comments and whitespace characters that it finds in your CSS.
Use Hummingbird’s Asset Optimization to compress all your CSS files.
See Dev Mode Optimization Tips above for insight on how to do safely optimize your files in Dev mode.
2.9.6 Eliminate render-blocking resources
Link to chapter 9If you fail the Render Blocking Requests audit, your PageSpeed report will list all the URLs blocking the first paint of your page.
You can reduce the impact of these render-blocking URLs by moving critical resources inline, deferring non-critical resources, and removing anything unused.
Hummingbird’s Asset Optimization feature has tools for moving, compressing, deferring, inlining and blocking resources.
See Dev Mode Optimization Tips above for insight on how to do safely optimize your files in Dev mode.
2.9.7 Reduce Unused CSS
Link to chapter 9Your PageSpeed test lists all stylesheets with unused CSS with a potential savings of 2 KBs or more. Removing unused CSS reduces unnecessary network activity.
Before using Hummingbird Pro to remove unused CSS, consider reducing, or switching, the number of the plugins loading unused CSS in your page.
You can identify plugins that are adding unnecessary CSS by running code coverage in Chrome DevTools. Use the stylesheet URL to identify the theme/plugin responsible. Look out for plugins that have a lot of stylesheets in the list with a lot of red in code coverage. A plugin should only enqueue a stylesheet if it is actually used on the page.
However, if you have the pro version of the plugin, you can activate the Critical CSS feature under Asset Optimization to prevent or delay the loading of unused CSS.
See Dev Mode Optimization Tips above for insight on how to do safely optimize your files in Dev mode.
2.9.8 Resolving Other Google Recommendations
Link to chapter 9The Google PageSpeed Insight audit provides recommendations in three sections:
- Opportunities provide suggestions for improving the page’s speed. The suggestions in this section estimate how much faster the page will load if the improvement is implemented.
- Diagnostics is information about how a page follows best practices for web development.
- Passed Audits are audits that meet the basic PageSpeed requirements.
It is important to note that improving Opportunities and Diagnostics do not directly affect the Google performance score. This means you may be able to make a page load faster without seeing an increase in your overall performance score.
There are about 20 Opportunities the Google PageSpeed test can recommend, and Smush Pro and Hummingbird Pro can be used to improve the results on 11 of these. The remaining recommendations are based on server quality, scripts, and the burdens created by connected 3rd-party services.
This section offers tips for resolving PageSpeed recommendations that cannot be addressed with our optimization plugins.
- Server response times are low – This audit fails when the browser waits more than 600 ms for the server to respond to the main document request. On WordPress websites, the server, plugins, and theme all have an impact on TTFB. Ensure you are using a quality host like WPMU DEV Hosting or upgrade your plan if you are failing this audit.
- Avoid multiple page redirects – The Google PageSpeed test flags pages that are redirected multiple times. Limit the number of redirects a page does. If you have both a desktop and mobile version you are redirecting to, consider using a responsive.
- Avoid an excessive DOM size – The DOM structure is based on the size and amount of content your site contains, and the theme, page builder, and plugins that are producing your HTML. If you are failing this audit, consider shifting to a new theme. If you are working on a site that has a lot of content, this will be difficult to resolve as Google flags sites that:
- Have more than 1,500 nodes in total.
- Have a depth greater than 32 nodes.
- Have a parent node with more than 60 child nodes.
- Preload key requests – Consider using
<link rel="preload">to prioritize code that is being requested later in page load. - Use video formats for animated content – Convert Animated GIF files to looping mp4 and/or WebM video files to save space and speed up load times.
- JavaScript execution time – Compression only goes so far, execution time still depends on how much there is actually going on in the scripts.
- Avoid enormous network payloads – This is the total size in kilobytes of all resources requested by your page. Optimizing images and minifying and compressing code files will help. You will fail this audit if your page’s total network requests exceed 5,000 KB. For optimal page performance, shoot to keep your total byte size below 1,600 KB.
- Minimize third-party usage – Calling third-party services with scripts slow things down. Examples of third-party scripts include social sharing buttons (e.g., X, Facebook), video player embeds (e.g., YouTube, Vimeo), advertising iframes, analytics and metrics scripts, and A/B testing scripts for experiments. It is important to note that even running the Google Analytics script to track information on your site will likely make it near impossible to score a 100 on your Google PageSpeed test.
2.10 Troubleshooting
Copy chapter anchor to clipboardThis chapter covers some troubleshooting tasks you can try by yourself, although members are welcome to contact support for assistance resolving any Hummingbird issues.
Critical CSS returns 503
If the Critical CSS feature returns a 503 error, check if you have maintenance mode enabled on your site. If yes, and you are using Branda, you can refer to our guide on how to disable Maintenance mode. For any other possible causes, please contact support.
If your site is protected by a firewall in a plugin or on your server, please be sure to add WPMU DEV IP addresses to the allowlist to avoid possible connection issues with the Critical CSS API.
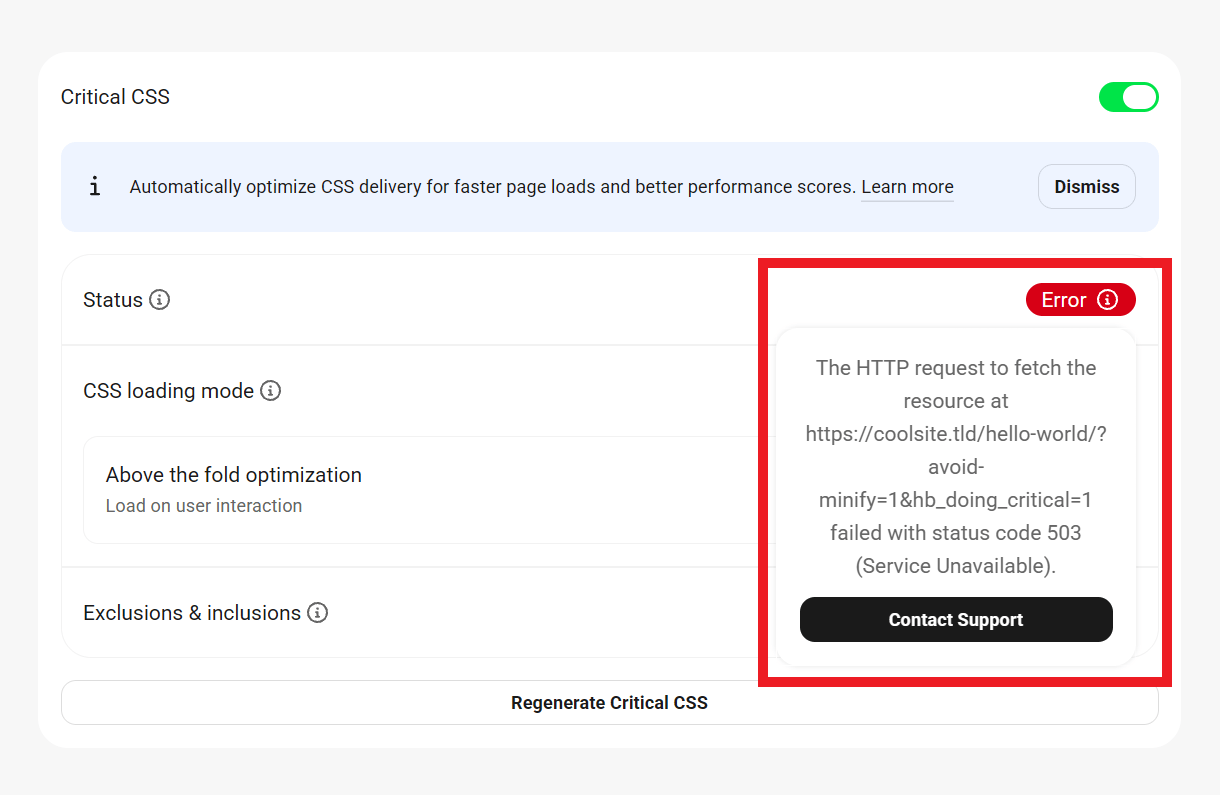
Cache errors after update
When updating your core WordPress with Page Cache active, things can occasionally get stuck in the cache, and a series of cache-related errors may appear on-screen at the top of the frontend pages of your site.
The solution to this issue is to delete the advanced-cache.php file from the wp-content directory. The cache-related errors will no longer exist and they will disappear from your frontend pages.
To get that done, log into your site’s server via SFTP or use a file manager utility in your hosting control panel. Navigate to the wp-content directory where you should see the advanced-cache.php file, and delete only that one file.

Warning: mkdir()
If you get warnings similar to the following on-screen when installing or activating Hummingbird on your site, it may be due to improper server configuration. It could also be due to a conflict with another plugin, theme or script, or even a temporary connection hiccup during the plugin installation.
Warning: mkdir(): Permission denied
Warning: Cannot modify header information – headers already sent
The first thing to try in this case is to delete Hummingbird from your site and re-install a fresh copy in case the previous attempt was corrupted. If that still returns the same errors, then log into your server as above and ensure the following 2 folders exist in the wp-content directory:
wphb-cache
wphb-logs
If either is missing, just create the missing directory and give it the correct permissions. Both of those folders should have the same default permissions as all other WordPress directories: 755

Uptime errors after changing domain
If you change the domain (URL) that your site resolves to (for example, in Settings > General in your site’s wp-admin, or when changing Primary domain name in your WPMU DEV Hub), the Uptime Monitor might still try to check the old domain that it was originally connected to, and return errors or report the site as down.
To resolve this issue, simply deactivate Uptime on the site, then reactivate it so it connects to the domain currently associated with the site.
2.11 Get Support
Copy chapter anchor to clipboardIf you still have questions or need assistance after reading this document, please don’t hesitate to contact our support superheroes using the available options under the Support tab in your Hub or via the Support tab in your WPMU DEV Dashboard.

